
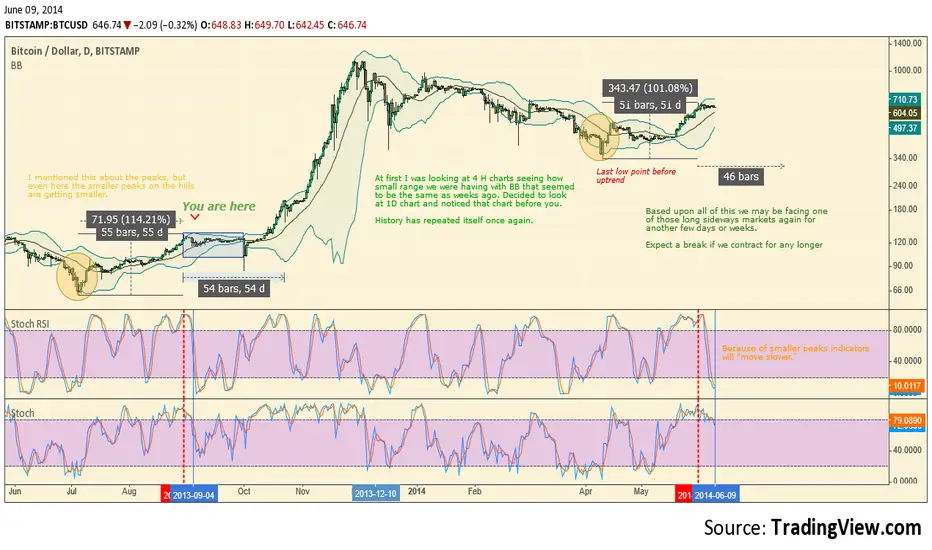
This was an interesting chart that I did. I have been busy and rather lazy since I did my last TA on that bull rectangle (apparently not a "flag" but w/e). At first when I fired up the chart I thought I would pull up some standard indicators that I use. When I opened the chart on 4H with BB on I was looking at how we were contracting into even tighter ranges. I got an idea to take a look at the 1D chart to see if I would see some type of repeating history. Well what I found is now laid before you on this chart.
Some of the first things I saw when looking at this chart were the fact the the rapid drop we had a few months back looked similar to the one almost a year ago. I then noticed that the BB contractions were doing the same thing. Next both StochRSI and Stoch were in the same zone as they were back then. "Odd," I thought to myself since it seems like there have been many patterns in Bitcoin's history. The date range and the price range just solidified it all together.
The question remains: Will it continue on the trajectory like it did before?
Now I had to think like an irrational market to come up with this one. My thoughts is that it is likely to go sideways for a little. Maybe a few weeks. Yet, watch for slow and noticeable moves up. Say moving up $5 per day at first then to $10. When you see this a break will likely happen and things will start moving again.
Want more? I did some thoughts on peer-to-peer mining pool P2Pool and something small about a dean's prediction for $120 around this time. allbitcointa.cu.cc/2014/06/what-51-attack-means-deans-prediction.html

관련 발행물
면책사항
해당 정보와 게시물은 금융, 투자, 트레이딩 또는 기타 유형의 조언이나 권장 사항으로 간주되지 않으며, 트레이딩뷰에서 제공하거나 보증하는 것이 아닙니다. 자세한 내용은 이용 약관을 참조하세요.
면책사항
해당 정보와 게시물은 금융, 투자, 트레이딩 또는 기타 유형의 조언이나 권장 사항으로 간주되지 않으며, 트레이딩뷰에서 제공하거나 보증하는 것이 아닙니다. 자세한 내용은 이용 약관을 참조하세요.