
~Bitcoin macro cycles~
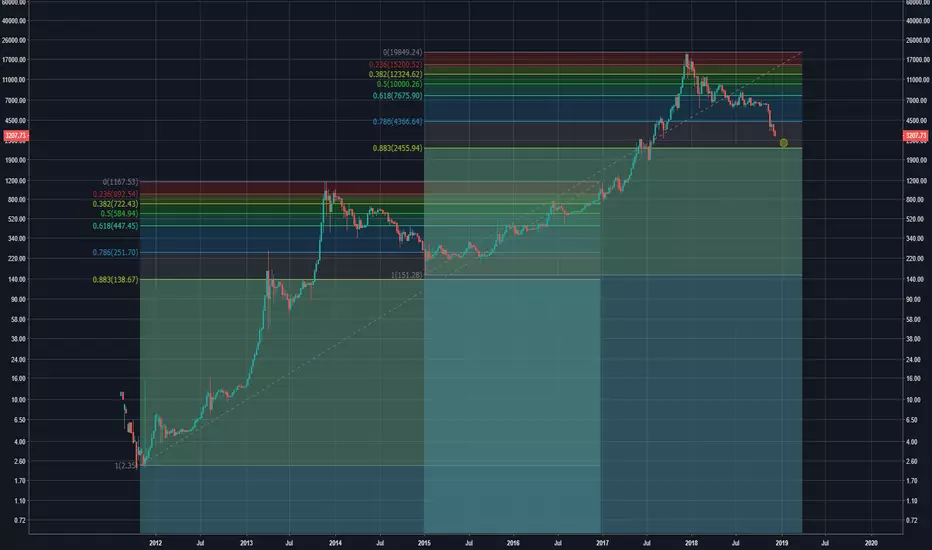
2013 bear market highlights:
87% pullback from peak ($1,162 - $152)
Took roughly 400 days to bottom out
Price found support right above .88 Fib level
2018 bear market prediction:
If we assume correlation between historical
price action and future price action,
BTC will find its bottom at between $2,500-$2,700 in mid January of 2019
This scenario would satisfy all three conditions of previous BTC bottoms
1) 87% selloff ($20,000 to $2,600)
2) 400 days from highest high to lowest low
3) Price bouncing right above the .88 Fib level
Give a like and a follow if you found this TA interesting and would like to see more of my content. I will be doing more charting like this going into 2019 and beyond. Cheers!
___________________________
*This is not investment advice*
2013 bear market highlights:
87% pullback from peak ($1,162 - $152)
Took roughly 400 days to bottom out
Price found support right above .88 Fib level
2018 bear market prediction:
If we assume correlation between historical
price action and future price action,
BTC will find its bottom at between $2,500-$2,700 in mid January of 2019
This scenario would satisfy all three conditions of previous BTC bottoms
1) 87% selloff ($20,000 to $2,600)
2) 400 days from highest high to lowest low
3) Price bouncing right above the .88 Fib level
Give a like and a follow if you found this TA interesting and would like to see more of my content. I will be doing more charting like this going into 2019 and beyond. Cheers!
___________________________
*This is not investment advice*

면책사항
해당 정보와 게시물은 금융, 투자, 트레이딩 또는 기타 유형의 조언이나 권장 사항으로 간주되지 않으며, 트레이딩뷰에서 제공하거나 보증하는 것이 아닙니다. 자세한 내용은 이용 약관을 참조하세요.
면책사항
해당 정보와 게시물은 금융, 투자, 트레이딩 또는 기타 유형의 조언이나 권장 사항으로 간주되지 않으며, 트레이딩뷰에서 제공하거나 보증하는 것이 아닙니다. 자세한 내용은 이용 약관을 참조하세요.