
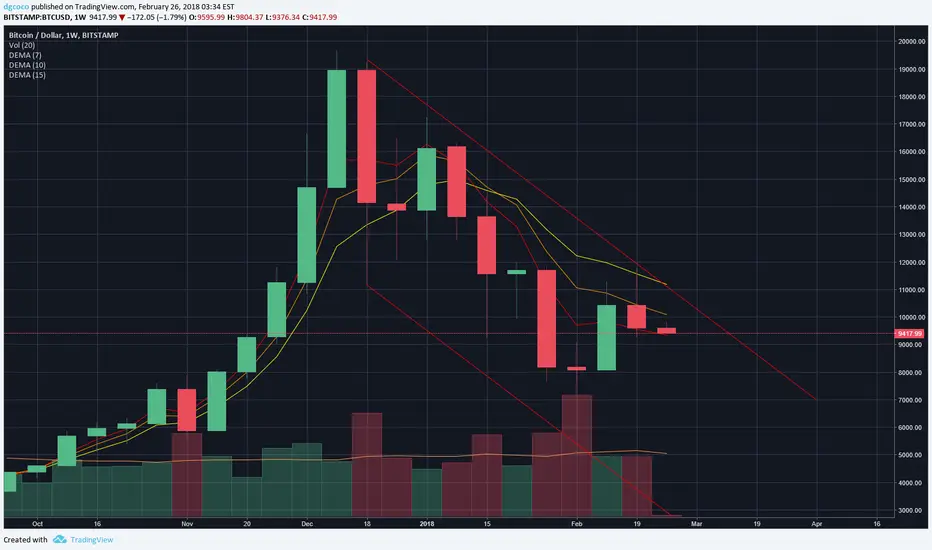
last week closed well below the 10- and 15-week dema line. we currently sit above the 7 week dema line but expect it to be tested likely in the immediate future. additionally, note that last week's candlestick took on somewhat of a shooting star formation, though not a true shooting star: the difference between open and high was not quite twice the body of the candle, and the lower wick was relatively long. nonetheless, we should look for other bearish confirmation signals in the coming weekly candlestick. if we fail to set a new high this week, expect the downtrend to continue. but as always, the best advisor is yourself, not a n00b like me.

면책사항
해당 정보와 게시물은 금융, 투자, 트레이딩 또는 기타 유형의 조언이나 권장 사항으로 간주되지 않으며, 트레이딩뷰에서 제공하거나 보증하는 것이 아닙니다. 자세한 내용은 이용 약관을 참조하세요.
면책사항
해당 정보와 게시물은 금융, 투자, 트레이딩 또는 기타 유형의 조언이나 권장 사항으로 간주되지 않으며, 트레이딩뷰에서 제공하거나 보증하는 것이 아닙니다. 자세한 내용은 이용 약관을 참조하세요.