
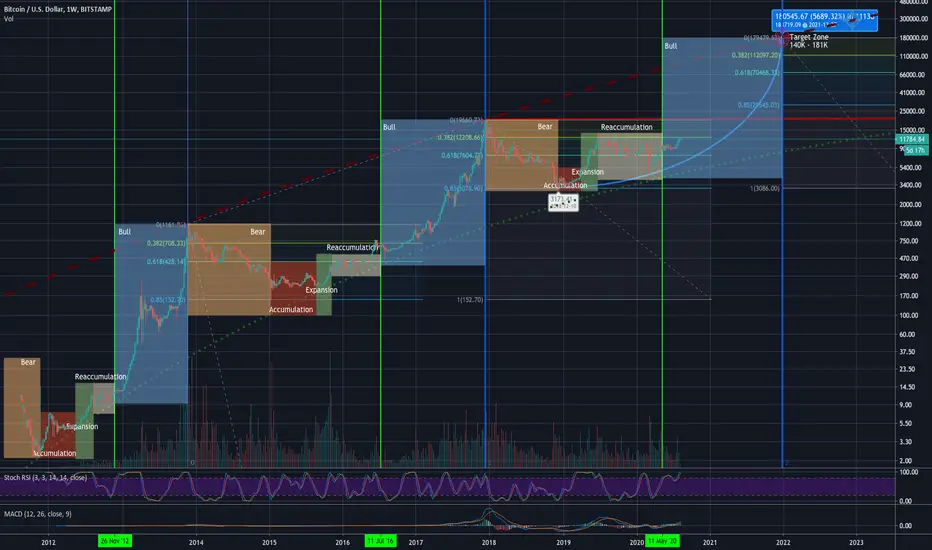
This idea is based on my idea of Bitcoin's future on a logarithmic scale from Jan 17, 2019.
Target is some corrected and I tried to show some zones depending on different market environments depending on peaks and events like halving. To define a target zone on a logarithmic scale is pretty meaningless and the fib retracments are a hint but cannot be crucial to define a peak End of 2021/Beginning 2022. This was guessing - looks nice but is still a prediction.
A better guess is to assume that the resistance curve is some more flat and could be hit at 140K
Please note that I deeply believe in this development but this is NOT A SUGGESTION to take a loan, debit your credit card to the edge, and buy Bitcoin like crazy. You rist your, your family's, company's and friends' wealth. Only risk what you can afford to lose.
Target is some corrected and I tried to show some zones depending on different market environments depending on peaks and events like halving. To define a target zone on a logarithmic scale is pretty meaningless and the fib retracments are a hint but cannot be crucial to define a peak End of 2021/Beginning 2022. This was guessing - looks nice but is still a prediction.
A better guess is to assume that the resistance curve is some more flat and could be hit at 140K
Please note that I deeply believe in this development but this is NOT A SUGGESTION to take a loan, debit your credit card to the edge, and buy Bitcoin like crazy. You rist your, your family's, company's and friends' wealth. Only risk what you can afford to lose.

관련 발행물
면책사항
해당 정보와 게시물은 금융, 투자, 트레이딩 또는 기타 유형의 조언이나 권장 사항으로 간주되지 않으며, 트레이딩뷰에서 제공하거나 보증하는 것이 아닙니다. 자세한 내용은 이용 약관을 참조하세요.
면책사항
해당 정보와 게시물은 금융, 투자, 트레이딩 또는 기타 유형의 조언이나 권장 사항으로 간주되지 않으며, 트레이딩뷰에서 제공하거나 보증하는 것이 아닙니다. 자세한 내용은 이용 약관을 참조하세요.