
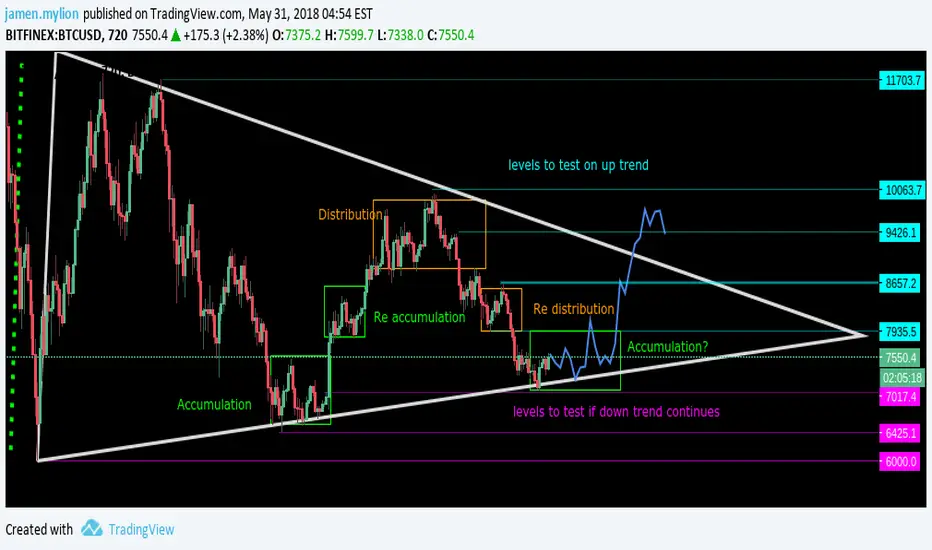
HI guys, So on the 12h you can see that we are in a symmetrical triangle , hopefully we accumulate in this area, and make a move up and break out, the rsi on the 12h indicates bullish divergence in play ,which will lead to a medium scale bull run,. usually triangle breakout target's are based on the base of the triangle , the question is are we going to accumulate here or just have a minor correction and break down .
Bullish target: 13.5k
Bearish target 1.3k ( these are long term targets ,and ,targets should be measured from where they break out from the triangle)
babypips.com/learn/forex/triangles.
We are still in a bear market, becarefull of misleading signals , wait for clear indications.
stockcharts.com/school/doku.php?id=chart_school:market_analysis:the_wyckoff_method
ccn.com/marketcap/- keep an eye on market caps and sentimental news, for it can effect technical analysis ,vice versa
Bullish target: 13.5k
Bearish target 1.3k ( these are long term targets ,and ,targets should be measured from where they break out from the triangle)
babypips.com/learn/forex/triangles.
We are still in a bear market, becarefull of misleading signals , wait for clear indications.
stockcharts.com/school/doku.php?id=chart_school:market_analysis:the_wyckoff_method
ccn.com/marketcap/- keep an eye on market caps and sentimental news, for it can effect technical analysis ,vice versa

면책사항
해당 정보와 게시물은 금융, 투자, 트레이딩 또는 기타 유형의 조언이나 권장 사항으로 간주되지 않으며, 트레이딩뷰에서 제공하거나 보증하는 것이 아닙니다. 자세한 내용은 이용 약관을 참조하세요.
면책사항
해당 정보와 게시물은 금융, 투자, 트레이딩 또는 기타 유형의 조언이나 권장 사항으로 간주되지 않으며, 트레이딩뷰에서 제공하거나 보증하는 것이 아닙니다. 자세한 내용은 이용 약관을 참조하세요.