
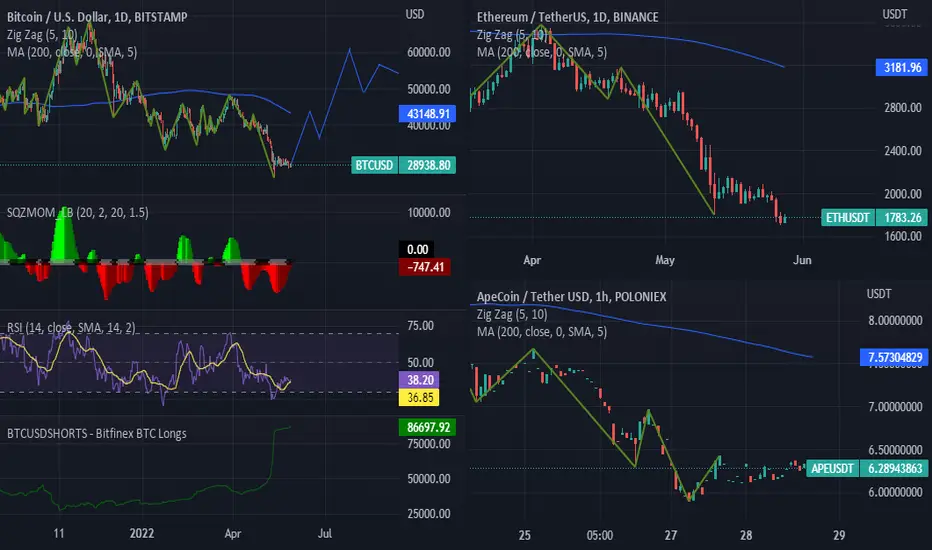
Ethereum and Bitcoin have both hit the lower end of the RSI Indicator. 8 weeks of red and frustration from recent events have created a situation where the new bull market could result in a possible new high. Most interestingly is the Weekly (14) RSI is at a history low indicating the market has exhausted its selling pressure. Targeting 63 RSI on the daily BITCOIN CHART followed by a correction before rocketing the Daily 73-77RSI range.

면책사항
해당 정보와 게시물은 금융, 투자, 트레이딩 또는 기타 유형의 조언이나 권장 사항으로 간주되지 않으며, 트레이딩뷰에서 제공하거나 보증하는 것이 아닙니다. 자세한 내용은 이용 약관을 참조하세요.
면책사항
해당 정보와 게시물은 금융, 투자, 트레이딩 또는 기타 유형의 조언이나 권장 사항으로 간주되지 않으며, 트레이딩뷰에서 제공하거나 보증하는 것이 아닙니다. 자세한 내용은 이용 약관을 참조하세요.