
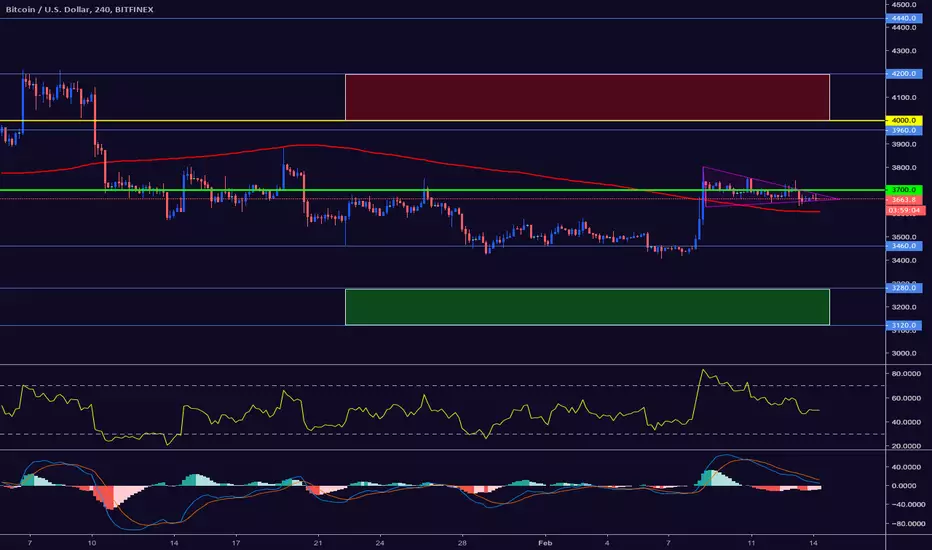
Bitcoin is trading inside a triangle pattern on the lower time frame, with the BTCUSD pair once again confined to extremely narrow ranges. Bulls failed to make progress about the $3,700 level, as the former weekly rally in the number one cryptocurrency stalls. A break below the triangle pattern would likely provoke a technical test of the important $3,460 support level.
The BTCUSD pair is strongly bullish while trading above the $3,700 level, key technical resistance is found at the $3,960 and $4,200 levels.
If the BTCUSD pair trades below the $3,460 level, key support remains at the $3,280 and $3,120 levels.
The BTCUSD pair is strongly bullish while trading above the $3,700 level, key technical resistance is found at the $3,960 and $4,200 levels.
If the BTCUSD pair trades below the $3,460 level, key support remains at the $3,280 and $3,120 levels.

관련 발행물
면책사항
해당 정보와 게시물은 금융, 투자, 트레이딩 또는 기타 유형의 조언이나 권장 사항으로 간주되지 않으며, 트레이딩뷰에서 제공하거나 보증하는 것이 아닙니다. 자세한 내용은 이용 약관을 참조하세요.
면책사항
해당 정보와 게시물은 금융, 투자, 트레이딩 또는 기타 유형의 조언이나 권장 사항으로 간주되지 않으며, 트레이딩뷰에서 제공하거나 보증하는 것이 아닙니다. 자세한 내용은 이용 약관을 참조하세요.