
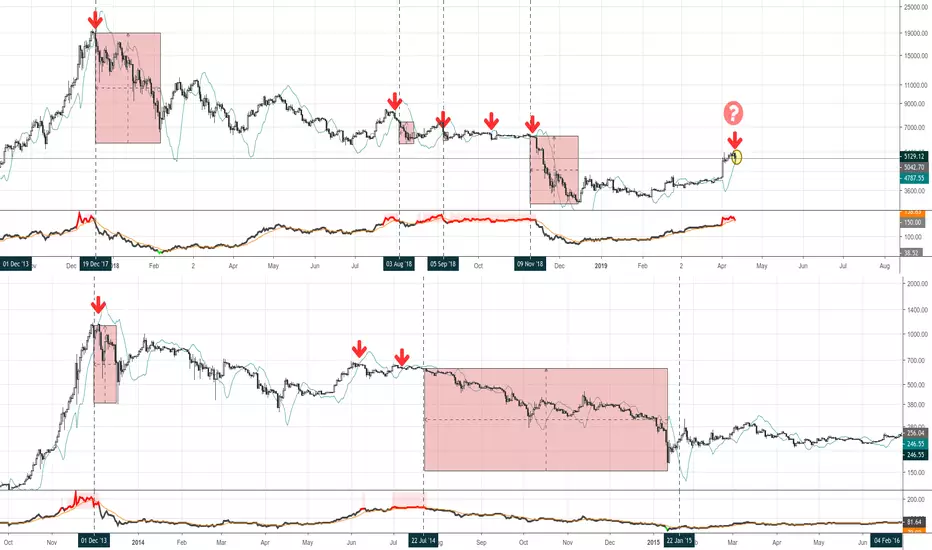
Now that the NVT indicator is back in the red zone, I wanted to look back at the Bitcoin chart to spot potential topping patterns.
I am seeing a likely NVT cross with its signal line by the end of the day (still unconfirmed).
And at the same time, I am plotting here the Dinapoli Momentum Switch indicator in search for key correlations.
And we can see two potential outcomes out of this event happening when the NVT line was red:
a) The start of a significant down correction
b) A choppy consolidation period in front of us where NVT would keep flashing red for some time... just to resolve in a significant down correction
Either way, the results look very consistent... not even a single time a bull trend has started right after these two factors were in confluence. I'd say it became quite the opposite. Is this time different?

I develop indicators meant to be useful, profitable and good looking.
면책사항
해당 정보와 게시물은 금융, 투자, 트레이딩 또는 기타 유형의 조언이나 권장 사항으로 간주되지 않으며, 트레이딩뷰에서 제공하거나 보증하는 것이 아닙니다. 자세한 내용은 이용 약관을 참조하세요.
I develop indicators meant to be useful, profitable and good looking.
면책사항
해당 정보와 게시물은 금융, 투자, 트레이딩 또는 기타 유형의 조언이나 권장 사항으로 간주되지 않으며, 트레이딩뷰에서 제공하거나 보증하는 것이 아닙니다. 자세한 내용은 이용 약관을 참조하세요.