
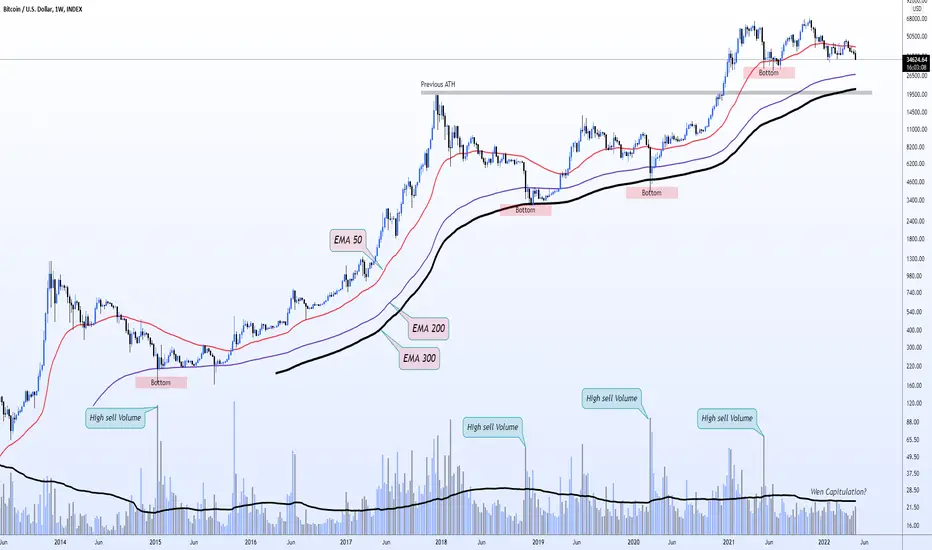
Bitcoin / Weekly / Log Chart
Bitcoin is supported by the 50,200,300 EMA Lines for the past many years. Whenever BTC Bottoms, We see a huge capitulation candle with high sell volume. This means many bulls gave up and they sold all their Bitcoins at the bottom. Later, We saw recovery and saw new ATHs From there.
Currently, We last saw a Capitulation at 29k Last year.
Now since BTC Lost the 50EMA, The price is slowly getting gravitated towards the 200EMA. if we break 29k, Our next support will be 27k. And the worst case will be 20k.
If in case if i see a capitulation candle when we slowly go downwards, That will be the point where i will buy multiple coins heavily.

면책사항
해당 정보와 게시물은 금융, 투자, 트레이딩 또는 기타 유형의 조언이나 권장 사항으로 간주되지 않으며, 트레이딩뷰에서 제공하거나 보증하는 것이 아닙니다. 자세한 내용은 이용 약관을 참조하세요.
면책사항
해당 정보와 게시물은 금융, 투자, 트레이딩 또는 기타 유형의 조언이나 권장 사항으로 간주되지 않으며, 트레이딩뷰에서 제공하거나 보증하는 것이 아닙니다. 자세한 내용은 이용 약관을 참조하세요.