
1-What's BTC market bias as of now?
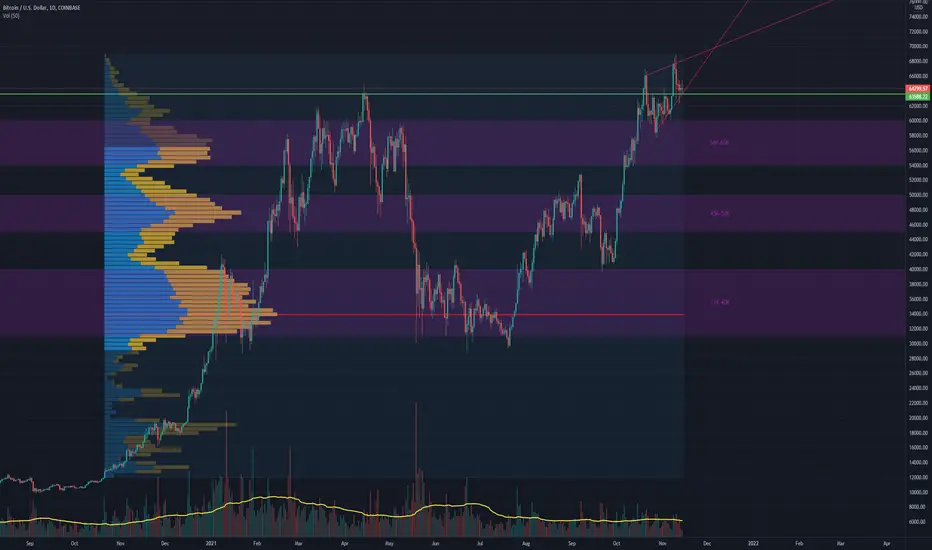
-Price has formed (or 90% formed) an ascending wedge (red lines), which indicates a down movement possiblity.
-Price is near monthly support (63K zone). If price breaks it, it will continue downward. If it bounces back, it will go to the wedge's upper limit (mentioned in a).
-Volume (yellow line at the bottom) is decreasing; less and less money has been used to buy BTC. This indicates a lack of interest in the market which drives people to avoid it or use as little amount of money as possible. Usually, this ends up with the price moving downward.
-The volume profile of the market shows that since the start of the year, large amount of money was poured in when the BTC price was around 31K-40K. The next wave of money poured in was around 45K-50K, and last one when the price was around 54K-60K. The amount of money used decreased respectively (shown in the left side of the chart as horizontal bars). Again, this has the same conclusion as the point above.
*Conclusion: market bias >>> Down movement.
2-Where would the price go to in that case?
-The regions mentioned above (31K-40K/45K-50K/54K-60K) act as support levels and the price will most likely move to one of them starting from the nearest (54K-60K) and bounce back up. If price doesn't bounce up, it will go to the region below it. In case the price falls below 31K-40K region, we can expect a market crash.

-Price has formed (or 90% formed) an ascending wedge (red lines), which indicates a down movement possiblity.
-Price is near monthly support (63K zone). If price breaks it, it will continue downward. If it bounces back, it will go to the wedge's upper limit (mentioned in a).
-Volume (yellow line at the bottom) is decreasing; less and less money has been used to buy BTC. This indicates a lack of interest in the market which drives people to avoid it or use as little amount of money as possible. Usually, this ends up with the price moving downward.
-The volume profile of the market shows that since the start of the year, large amount of money was poured in when the BTC price was around 31K-40K. The next wave of money poured in was around 45K-50K, and last one when the price was around 54K-60K. The amount of money used decreased respectively (shown in the left side of the chart as horizontal bars). Again, this has the same conclusion as the point above.
*Conclusion: market bias >>> Down movement.
2-Where would the price go to in that case?
-The regions mentioned above (31K-40K/45K-50K/54K-60K) act as support levels and the price will most likely move to one of them starting from the nearest (54K-60K) and bounce back up. If price doesn't bounce up, it will go to the region below it. In case the price falls below 31K-40K region, we can expect a market crash.

면책사항
해당 정보와 게시물은 금융, 투자, 트레이딩 또는 기타 유형의 조언이나 권장 사항으로 간주되지 않으며, 트레이딩뷰에서 제공하거나 보증하는 것이 아닙니다. 자세한 내용은 이용 약관을 참조하세요.
면책사항
해당 정보와 게시물은 금융, 투자, 트레이딩 또는 기타 유형의 조언이나 권장 사항으로 간주되지 않으며, 트레이딩뷰에서 제공하거나 보증하는 것이 아닙니다. 자세한 내용은 이용 약관을 참조하세요.