
Bitcoin technical analysis update (Weekly Chart)
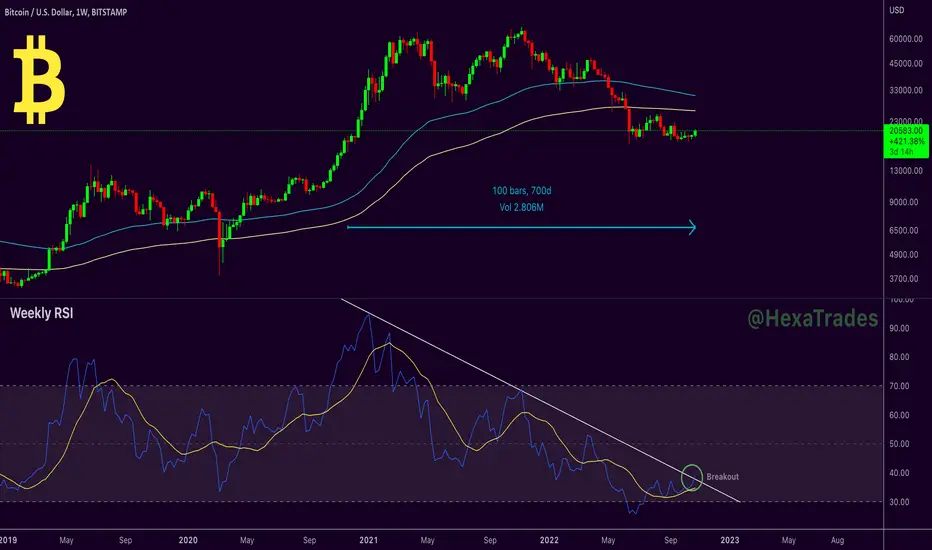
Bitcoin's weekly RSI falling from the last 2 years, In December 2020 weekly RSI touched 95 overbought levels, at the time BTC was trading at $42000 after that RSI started falling.
In the above chart, you can see Bitcoin 2 year-long Weekly RSI breakout above its trend resistance line, this is a good bullish sign for bitcoin.
Thanks
Hexa
Bitcoin's weekly RSI falling from the last 2 years, In December 2020 weekly RSI touched 95 overbought levels, at the time BTC was trading at $42000 after that RSI started falling.
In the above chart, you can see Bitcoin 2 year-long Weekly RSI breakout above its trend resistance line, this is a good bullish sign for bitcoin.
Thanks
Hexa
노트
Chart Update
🚀Telegram : t.me/hexatrades
🌐Website: hexatrades.io/
🗣️Twitter(X): twitter.com/HexaTrades
🌐Website: hexatrades.io/
🗣️Twitter(X): twitter.com/HexaTrades
관련 발행물
면책사항
해당 정보와 게시물은 금융, 투자, 트레이딩 또는 기타 유형의 조언이나 권장 사항으로 간주되지 않으며, 트레이딩뷰에서 제공하거나 보증하는 것이 아닙니다. 자세한 내용은 이용 약관을 참조하세요.
🚀Telegram : t.me/hexatrades
🌐Website: hexatrades.io/
🗣️Twitter(X): twitter.com/HexaTrades
🌐Website: hexatrades.io/
🗣️Twitter(X): twitter.com/HexaTrades
관련 발행물
면책사항
해당 정보와 게시물은 금융, 투자, 트레이딩 또는 기타 유형의 조언이나 권장 사항으로 간주되지 않으며, 트레이딩뷰에서 제공하거나 보증하는 것이 아닙니다. 자세한 내용은 이용 약관을 참조하세요.