
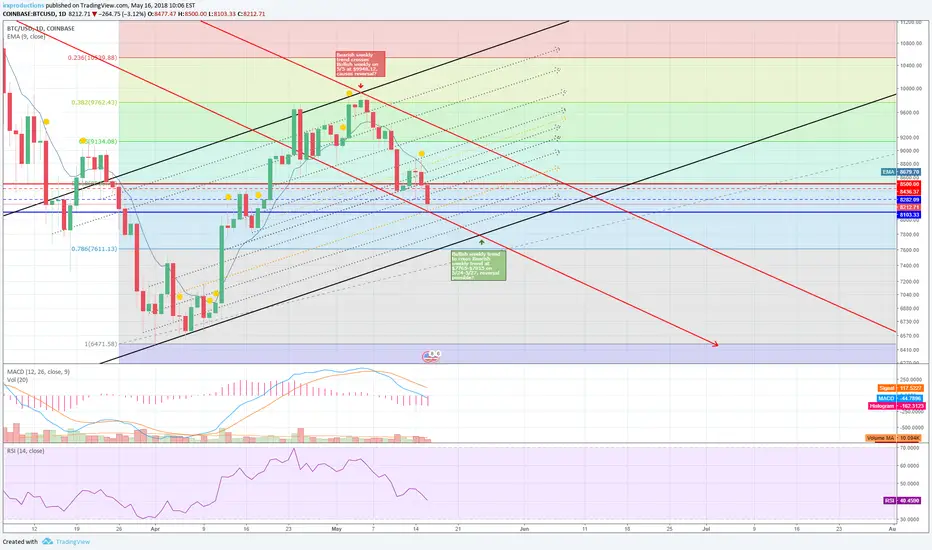
Looking at Bitcoin in the long-term using weekly trend lines, the recent Bearish reversal happened on 5/5 at a high of $9948.12 when a Bearish weekly trend (upper solid red) crossed with a Bullish weekly trend (upper black red).
Taking the theory to the next step, a lower Bearish weekly trend line (lower solid red) may cross with a lower Bullish weekly trend (lower solid black) between 5/24-5/27 at a rough price estimate of $7,765-$7,815.
Could this cause another reversal?
I'm still incredibly green at crypto Technical Analysis, so I'm hoping for to hear suggestions, ideas, and errors I may be making. Thanks, everyone!
Taking the theory to the next step, a lower Bearish weekly trend line (lower solid red) may cross with a lower Bullish weekly trend (lower solid black) between 5/24-5/27 at a rough price estimate of $7,765-$7,815.
Could this cause another reversal?
I'm still incredibly green at crypto Technical Analysis, so I'm hoping for to hear suggestions, ideas, and errors I may be making. Thanks, everyone!

면책사항
해당 정보와 게시물은 금융, 투자, 트레이딩 또는 기타 유형의 조언이나 권장 사항으로 간주되지 않으며, 트레이딩뷰에서 제공하거나 보증하는 것이 아닙니다. 자세한 내용은 이용 약관을 참조하세요.
면책사항
해당 정보와 게시물은 금융, 투자, 트레이딩 또는 기타 유형의 조언이나 권장 사항으로 간주되지 않으며, 트레이딩뷰에서 제공하거나 보증하는 것이 아닙니다. 자세한 내용은 이용 약관을 참조하세요.