
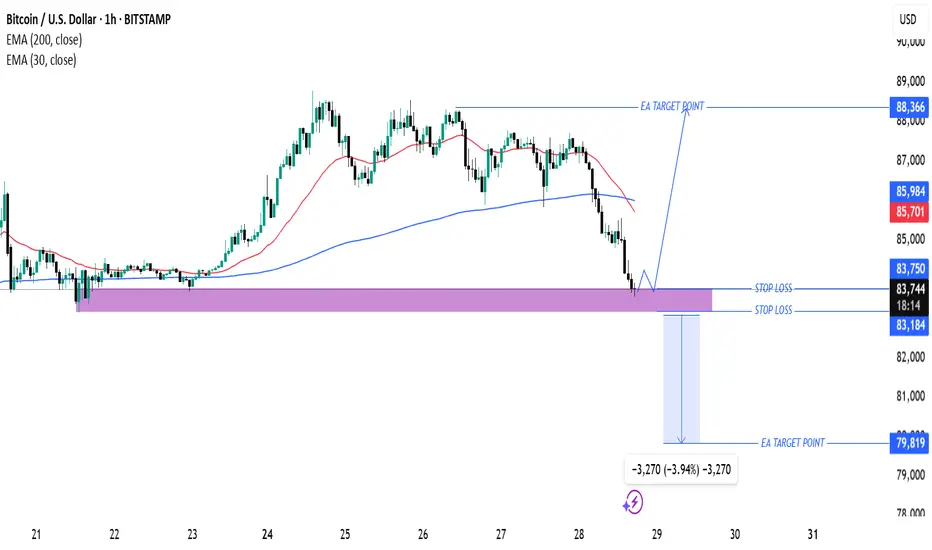
This chart is a Bitcoin (BTC/USD) price analysis on a 1-hour timeframe from TradingView. Here are the key insights:
Technical Indicators:
Exponential Moving Averages (EMAs):
200 EMA (blue): 85,984 (indicates long-term trend support/resistance).
30 EMA (red): 85,705 (short-term trend direction).
Support & Resistance Zones:
Purple Zone (Support Area): This area has been tested multiple times and is expected to provide a strong buying zone.
Resistance/Target Levels:
Upper EA Target Point: 88,366 (potential bullish target).
Lower EA Target Point: 79,819 (potential bearish target).
Trade Setup:
Entry Point: Around 83,810 (current price near support).
Stop Loss Levels:
Conservative: Around 83,750
Aggressive: Around 83,184
Target Point: 88,366 (bullish) or 79,819 (bearish).
Market Outlook:
The price is currently testing a key support zone.
If the support holds, we may see a bullish reversal toward 88,366.
If the price breaks below the support, further downside to 79,819 is possible.
Technical Indicators:
Exponential Moving Averages (EMAs):
200 EMA (blue): 85,984 (indicates long-term trend support/resistance).
30 EMA (red): 85,705 (short-term trend direction).
Support & Resistance Zones:
Purple Zone (Support Area): This area has been tested multiple times and is expected to provide a strong buying zone.
Resistance/Target Levels:
Upper EA Target Point: 88,366 (potential bullish target).
Lower EA Target Point: 79,819 (potential bearish target).
Trade Setup:
Entry Point: Around 83,810 (current price near support).
Stop Loss Levels:
Conservative: Around 83,750
Aggressive: Around 83,184
Target Point: 88,366 (bullish) or 79,819 (bearish).
Market Outlook:
The price is currently testing a key support zone.
If the support holds, we may see a bullish reversal toward 88,366.
If the price breaks below the support, further downside to 79,819 is possible.

JOIN MY TELEGRAM CHANNEL
t.me/+wtxM9EtZ_AVjYmFk
t.me/+wtxM9EtZ_AVjYmFk
t.me/+wtxM9EtZ_AVjYmFk
t.me/+wtxM9EtZ_AVjYmFk
면책사항
해당 정보와 게시물은 금융, 투자, 트레이딩 또는 기타 유형의 조언이나 권장 사항으로 간주되지 않으며, 트레이딩뷰에서 제공하거나 보증하는 것이 아닙니다. 자세한 내용은 이용 약관을 참조하세요.
JOIN MY TELEGRAM CHANNEL
t.me/+wtxM9EtZ_AVjYmFk
t.me/+wtxM9EtZ_AVjYmFk
t.me/+wtxM9EtZ_AVjYmFk
t.me/+wtxM9EtZ_AVjYmFk
면책사항
해당 정보와 게시물은 금융, 투자, 트레이딩 또는 기타 유형의 조언이나 권장 사항으로 간주되지 않으며, 트레이딩뷰에서 제공하거나 보증하는 것이 아닙니다. 자세한 내용은 이용 약관을 참조하세요.