
₿ BTCUSD – 1H CHART ANALYSIS
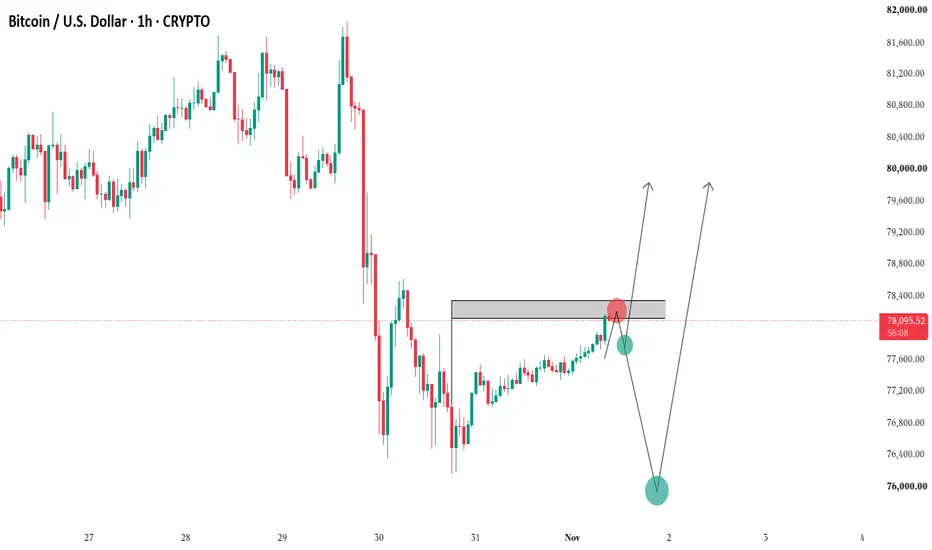
Bitcoin is currently moving towards a strong resistance zone around $78,100–$78,350, where sellers may attempt to take control.
The market is showing a gradual bullish recovery, but price is now approaching an important decision area.
🔴 Bearish Scenario:
If BTC fails to break the resistance zone and shows strong rejection, we may see a downside move towards $77,600, followed by $76,000.
🟢 Bullish Scenario:
If price successfully breaks above the supply zone and sustains its position, further upside towards $79,800–$80,000 could become possible.
🎯 My Focus:
I am watching the reaction around the resistance zone. A clear breakout or confirmed rejection will determine the next potential move.
⚠️ No blind entries. Wait for confirmation and always protect your SL.
Patience is the key. Let the market show its direction.
Bitcoin is currently moving towards a strong resistance zone around $78,100–$78,350, where sellers may attempt to take control.
The market is showing a gradual bullish recovery, but price is now approaching an important decision area.
🔴 Bearish Scenario:
If BTC fails to break the resistance zone and shows strong rejection, we may see a downside move towards $77,600, followed by $76,000.
🟢 Bullish Scenario:
If price successfully breaks above the supply zone and sustains its position, further upside towards $79,800–$80,000 could become possible.
🎯 My Focus:
I am watching the reaction around the resistance zone. A clear breakout or confirmed rejection will determine the next potential move.
⚠️ No blind entries. Wait for confirmation and always protect your SL.
Patience is the key. Let the market show its direction.

면책사항
해당 정보와 게시물은 금융, 투자, 트레이딩 또는 기타 유형의 조언이나 권장 사항으로 간주되지 않으며, 트레이딩뷰에서 제공하거나 보증하는 것이 아닙니다. 자세한 내용은 이용 약관을 참조하세요.
면책사항
해당 정보와 게시물은 금융, 투자, 트레이딩 또는 기타 유형의 조언이나 권장 사항으로 간주되지 않으며, 트레이딩뷰에서 제공하거나 보증하는 것이 아닙니다. 자세한 내용은 이용 약관을 참조하세요.