
Hi All,
I don't see doom and gloom yet.
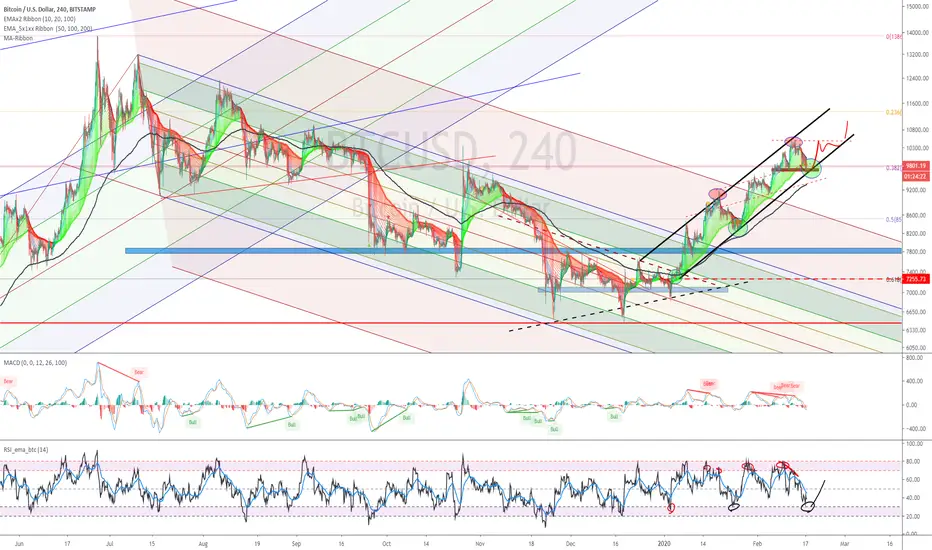
If we have a 12 hrly or daily close below 9700, then I will become bearish.
However we are still in the channel and above the 9700 - 9750) and as I see it, every so often, the support has to be tested on this channel and the bulls have to defend it.
BTC has been pulling back on this channel ride so its no surprise. And I don't think its time for the 21 weekly EMA to be tested yet.
A pullback to the next major support or fib level is reasonable.
We have the RSI still maintaining its fluidity\rhythm of an uptrend.
We have RSI hitting its peak
We have the 0.382 at the macro level in confluence with the channel support level as of now.
And we have convergence on the daily based on the MACD.
All positive.
As for the 10500 mark, it was a clear resistance zone however I too was not prepared for it as I should have, getting carried away with the bullish of the run.
If one was to look carefully at the top, on the 4 hrly or 8 hrly, the signs were there for a pullback.
What we have going for us is the momentum and the logical pullback, big bearish divergence on the daily, its playing out.
As indicated on the chart, we have the logical explanation as to where we are at.
Please don't forget to give me a tick\like, as I would appreciate it.
Regards,
S.Sari
(for my reference > Macro.charts)
Signs of a pullback


Still maintaining higher lowers and higher highs

I don't see doom and gloom yet.
If we have a 12 hrly or daily close below 9700, then I will become bearish.
However we are still in the channel and above the 9700 - 9750) and as I see it, every so often, the support has to be tested on this channel and the bulls have to defend it.
BTC has been pulling back on this channel ride so its no surprise. And I don't think its time for the 21 weekly EMA to be tested yet.
A pullback to the next major support or fib level is reasonable.
We have the RSI still maintaining its fluidity\rhythm of an uptrend.
We have RSI hitting its peak
We have the 0.382 at the macro level in confluence with the channel support level as of now.
And we have convergence on the daily based on the MACD.
All positive.
As for the 10500 mark, it was a clear resistance zone however I too was not prepared for it as I should have, getting carried away with the bullish of the run.
If one was to look carefully at the top, on the 4 hrly or 8 hrly, the signs were there for a pullback.
What we have going for us is the momentum and the logical pullback, big bearish divergence on the daily, its playing out.
As indicated on the chart, we have the logical explanation as to where we are at.
Please don't forget to give me a tick\like, as I would appreciate it.
Regards,
S.Sari
(for my reference > Macro.charts)
Signs of a pullback
Still maintaining higher lowers and higher highs
노트
Looking at the previous channel support, the 4 HRLY 150 EMA played a role. I'm wondering if this is the same as it has confluence with the support level as well and the 0.65 fib level retracement. ETH also has a similar scenario. Hence I entered for a short, not BTC but ETH.노트
A possibility depending on the bounce momentum노트
21 EMA on the daily holding. As per wave 3 likelihood for shallow pullbacks.노트
노트
This is a better perspective, after adding fib channels and fib. circle.노트
Looks like a diamond reversal pattern to me. Correction is taking place.For this pullback, as per chart, 9050 to 9200 range, which has confluence with the monthly support level. It also has confluence with the main fib level and EMA's of 50 and 100 range. After this, straight up towards 10650 to 11050 which is the next strong resistance range.

Discord: discord.com/invite/vb4hbP88vb (TradeToProspa)
Telegram: t.me/TprospaTradersbot
This community has signals now but with no risk management comms.
Telegram: t.me/TprospaTradersbot
This community has signals now but with no risk management comms.
관련 발행물
면책사항
해당 정보와 게시물은 금융, 투자, 트레이딩 또는 기타 유형의 조언이나 권장 사항으로 간주되지 않으며, 트레이딩뷰에서 제공하거나 보증하는 것이 아닙니다. 자세한 내용은 이용 약관을 참조하세요.
Discord: discord.com/invite/vb4hbP88vb (TradeToProspa)
Telegram: t.me/TprospaTradersbot
This community has signals now but with no risk management comms.
Telegram: t.me/TprospaTradersbot
This community has signals now but with no risk management comms.
관련 발행물
면책사항
해당 정보와 게시물은 금융, 투자, 트레이딩 또는 기타 유형의 조언이나 권장 사항으로 간주되지 않으며, 트레이딩뷰에서 제공하거나 보증하는 것이 아닙니다. 자세한 내용은 이용 약관을 참조하세요.