I'm not trading  BTCUSD or cryptos actively but "a chart is a chart" as my my master (he's called MightyOne) says.
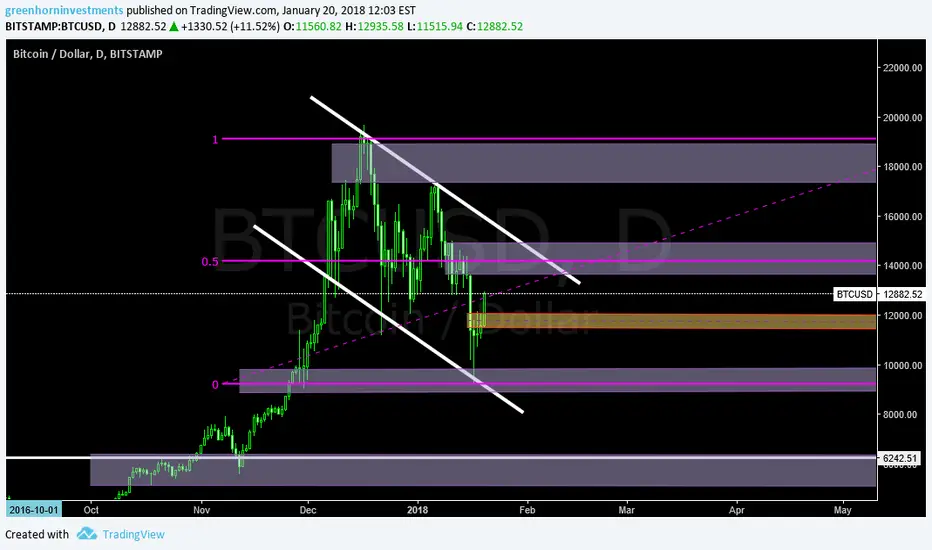
This is how i draw price levels (Supply&Demand) over my charts:
1) Supply is a zone (it doesn't matter how you are drawing it) around the top aka 0% or 25% RET in this chart.
2) Demand is a zone (it doesn't matter how you are drawing it) around the bottom aka 100% or 75% RET in this chart.
3) The midpoint is the midpoint LOL! Use it to take profits or to push in your direction when price is moving away from the actual range.
BTCUSD or cryptos actively but "a chart is a chart" as my my master (he's called MightyOne) says.This is how i draw price levels (Supply&Demand) over my charts:
1) Supply is a zone (it doesn't matter how you are drawing it) around the top aka 0% or 25% RET in this chart.
2) Demand is a zone (it doesn't matter how you are drawing it) around the bottom aka 100% or 75% RET in this chart.
3) The midpoint is the midpoint LOL! Use it to take profits or to push in your direction when price is moving away from the actual range.

면책사항
해당 정보와 게시물은 금융, 투자, 트레이딩 또는 기타 유형의 조언이나 권장 사항으로 간주되지 않으며, 트레이딩뷰에서 제공하거나 보증하는 것이 아닙니다. 자세한 내용은 이용 약관을 참조하세요.
면책사항
해당 정보와 게시물은 금융, 투자, 트레이딩 또는 기타 유형의 조언이나 권장 사항으로 간주되지 않으며, 트레이딩뷰에서 제공하거나 보증하는 것이 아닙니다. 자세한 내용은 이용 약관을 참조하세요.