
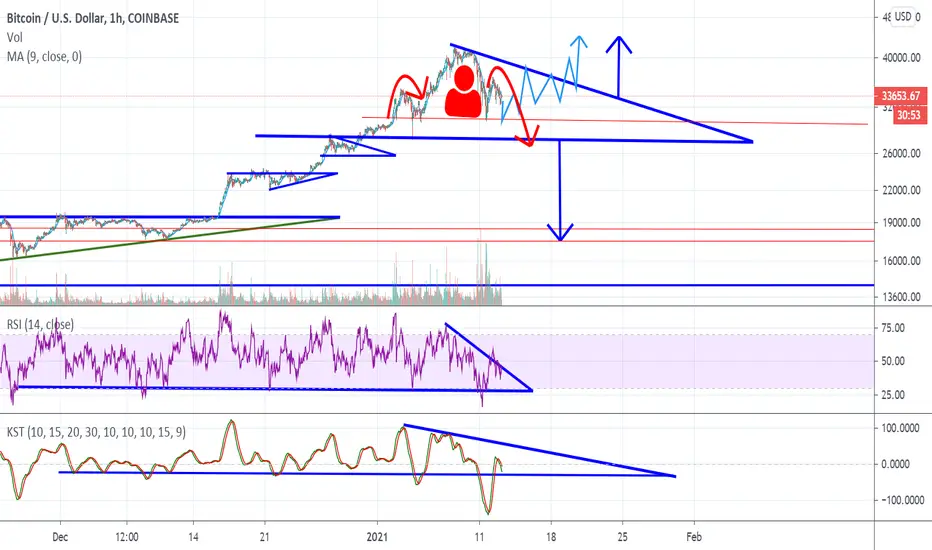
Bitcoin is potentially forming a giant H&S pattern inside of a larger Descending Triangle or Bullish Flag.
In light blue, I have drawn a hypothetical price scenario.
The RSI is breaking the downward sloping resistance of a descending triangle formation.
The KST saw a sharp deviation but has since found itself back into what could turn out as a bull flag or descending triangle.
In Dark Red inside the price pattern is potentially an H&S pattern.
In light blue, I have drawn a hypothetical price scenario.
The RSI is breaking the downward sloping resistance of a descending triangle formation.
The KST saw a sharp deviation but has since found itself back into what could turn out as a bull flag or descending triangle.
In Dark Red inside the price pattern is potentially an H&S pattern.
노트
Bullish cross now apparent on the KST, updated chart here.. 

관련 발행물
면책사항
해당 정보와 게시물은 금융, 투자, 트레이딩 또는 기타 유형의 조언이나 권장 사항으로 간주되지 않으며, 트레이딩뷰에서 제공하거나 보증하는 것이 아닙니다. 자세한 내용은 이용 약관을 참조하세요.
면책사항
해당 정보와 게시물은 금융, 투자, 트레이딩 또는 기타 유형의 조언이나 권장 사항으로 간주되지 않으며, 트레이딩뷰에서 제공하거나 보증하는 것이 아닙니다. 자세한 내용은 이용 약관을 참조하세요.