
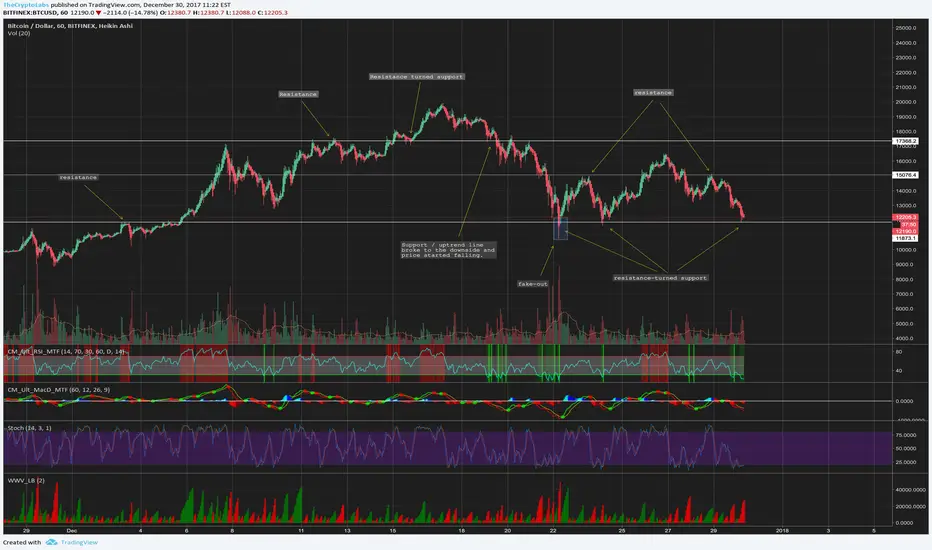
Support and resistance levels are critical in financial markets.
They are very similar to pivot points, except simpler.
When the price of a pair goes up to $10,000 and goes down to $9000 USD, that $10,000 USD zone is now resistance. If it bounces from $9000 and up to $11,000, the $9000 level is now support and the $10,000 resistance is now broken and could potentially turn support, where it can bounce.
Generally, for resistance or support to break, a candle has to close above or below support and resistance. A wick above either is only the price “testing” resistance.
I generally wait for a close above / below as well as further movement in the same direction, and a possible volume break-out short term.
This is because a close above / below itself can be a fake-out, or a fake breakout, and continue doing what it originally was.The blue box is an example of a fake-out.
The more often support and resistance is tested, the stronger it is.
The stronger support or resistance zones are, the stronger they will break out.
For example, if a support is tested 5 times and breaks to the downside, it will move down further than for example, if it was tested 2 or 3 times.
Next post we will get into support or resistance zones and also examples on how to trade them.
They are very similar to pivot points, except simpler.
When the price of a pair goes up to $10,000 and goes down to $9000 USD, that $10,000 USD zone is now resistance. If it bounces from $9000 and up to $11,000, the $9000 level is now support and the $10,000 resistance is now broken and could potentially turn support, where it can bounce.
Generally, for resistance or support to break, a candle has to close above or below support and resistance. A wick above either is only the price “testing” resistance.
I generally wait for a close above / below as well as further movement in the same direction, and a possible volume break-out short term.
This is because a close above / below itself can be a fake-out, or a fake breakout, and continue doing what it originally was.The blue box is an example of a fake-out.
The more often support and resistance is tested, the stronger it is.
The stronger support or resistance zones are, the stronger they will break out.
For example, if a support is tested 5 times and breaks to the downside, it will move down further than for example, if it was tested 2 or 3 times.
Next post we will get into support or resistance zones and also examples on how to trade them.
노트
if you press play and see the price, you can see the support i drew allowed the price to bounce, perfect example!노트
now it is being resisted by resistance level arrows point to노트
heading to 17k resistance
면책사항
해당 정보와 게시물은 금융, 투자, 트레이딩 또는 기타 유형의 조언이나 권장 사항으로 간주되지 않으며, 트레이딩뷰에서 제공하거나 보증하는 것이 아닙니다. 자세한 내용은 이용 약관을 참조하세요.
면책사항
해당 정보와 게시물은 금융, 투자, 트레이딩 또는 기타 유형의 조언이나 권장 사항으로 간주되지 않으며, 트레이딩뷰에서 제공하거나 보증하는 것이 아닙니다. 자세한 내용은 이용 약관을 참조하세요.