Recently noticed a pattern in the charts.
The third chart is a piece of pine script I wrote to help visualize BTCUSDSHORTS and BTCUSDLONGS.
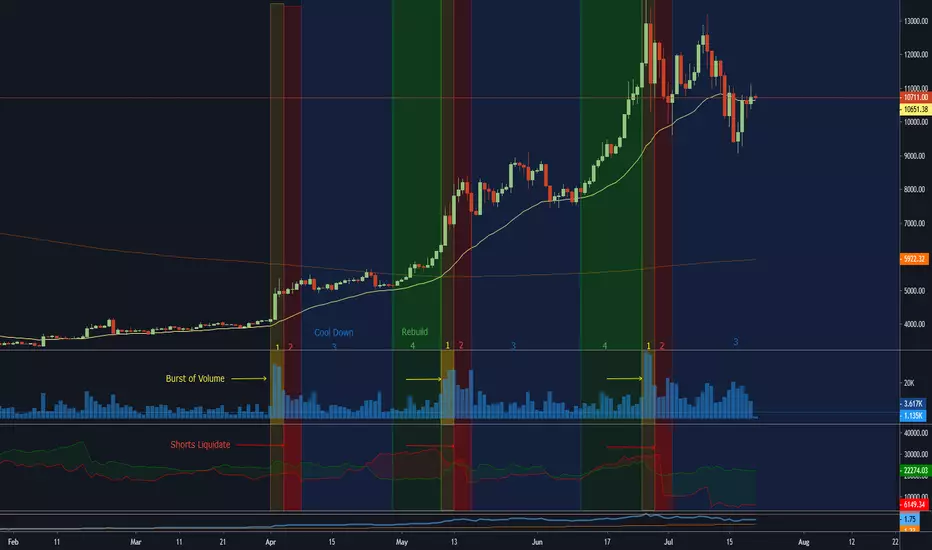
A drop in open shorts has been preceded by large volume pushing the price higher, likely into many stops, continuing the rally.

As you can see, after the action has cooled down price, will move to the 30 day EMA before it picks up again. Except for this last time. Price plunged under the 30 day EMA before it snapped back to the EMA. Also, the amount of open shorts on Bitfinex is the lowest its been.

This leads me to believe the cool down period will last longer than the previous ones.
The third chart is a piece of pine script I wrote to help visualize
BTCUSDSHORTS and BTCUSDLONGS. A drop in open shorts has been preceded by large volume pushing the price higher, likely into many stops, continuing the rally.
As you can see, after the action has cooled down price, will move to the 30 day EMA before it picks up again. Except for this last time. Price plunged under the 30 day EMA before it snapped back to the EMA. Also, the amount of open shorts on Bitfinex is the lowest its been.
This leads me to believe the cool down period will last longer than the previous ones.

면책사항
해당 정보와 게시물은 금융, 투자, 트레이딩 또는 기타 유형의 조언이나 권장 사항으로 간주되지 않으며, 트레이딩뷰에서 제공하거나 보증하는 것이 아닙니다. 자세한 내용은 이용 약관을 참조하세요.
면책사항
해당 정보와 게시물은 금융, 투자, 트레이딩 또는 기타 유형의 조언이나 권장 사항으로 간주되지 않으며, 트레이딩뷰에서 제공하거나 보증하는 것이 아닙니다. 자세한 내용은 이용 약관을 참조하세요.