📈 Description:
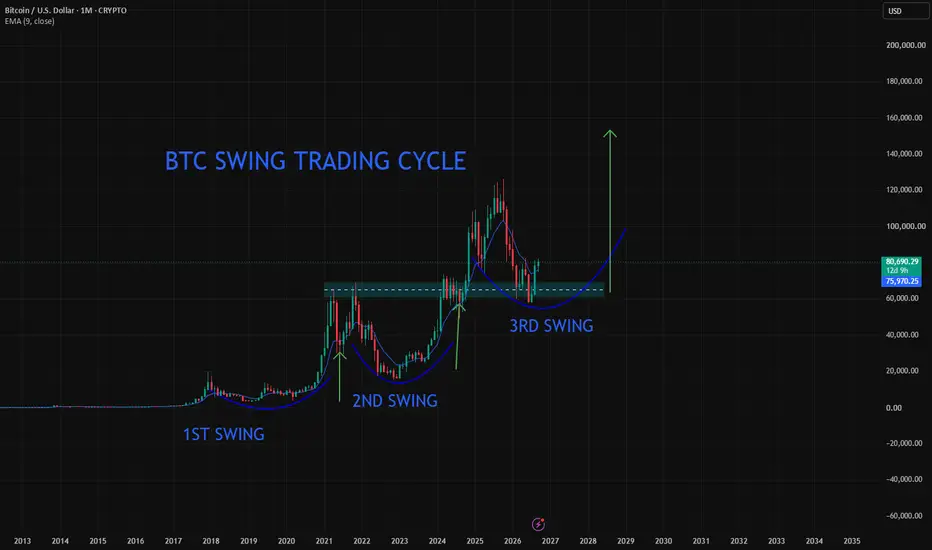
Bitcoin has historically moved through different major swing phases and market cycles. In this analysis, I have mapped the 1st Swing, 2nd Swing, and 3rd Swing on the BTC/USD monthly chart to understand the broader structure and how the current phase may develop.
🔹 1st Swing – Initial major expansion and correction
🔹 2nd Swing – Stronger market expansion followed by a deep correction
🔹 3rd Swing – Current cycle structure and key support area
🔹 Key Support Zone – Important area to watch for the current structure
🔹 EMA 9 – Used to track the broader monthly momentum
🔹 Long-Term BTC Cycle – Historical structure vs. current market movement
🔹 Potential Future Zone – Chart-based projection shown for educational analysis
The main purpose of this chart is to study Bitcoin's historical swing behaviour and compare it with the current market structure, rather than predict the exact future price.
📌 Chart: BTC/USD – Monthly
📌 Time Horizon: Long Term
📌 Analysis Type: Swing Trading / Market Cycle Analysis
⚠️ Disclaimer: This content is for educational and informational purposes only. It is not financial or investment advice. Cryptocurrency trading involves significant risk. Always do your own research and use proper risk management. BTCUSD
Bitcoin has historically moved through different major swing phases and market cycles. In this analysis, I have mapped the 1st Swing, 2nd Swing, and 3rd Swing on the BTC/USD monthly chart to understand the broader structure and how the current phase may develop.
🔹 1st Swing – Initial major expansion and correction
🔹 2nd Swing – Stronger market expansion followed by a deep correction
🔹 3rd Swing – Current cycle structure and key support area
🔹 Key Support Zone – Important area to watch for the current structure
🔹 EMA 9 – Used to track the broader monthly momentum
🔹 Long-Term BTC Cycle – Historical structure vs. current market movement
🔹 Potential Future Zone – Chart-based projection shown for educational analysis
The main purpose of this chart is to study Bitcoin's historical swing behaviour and compare it with the current market structure, rather than predict the exact future price.
📌 Chart: BTC/USD – Monthly
📌 Time Horizon: Long Term
📌 Analysis Type: Swing Trading / Market Cycle Analysis
⚠️ Disclaimer: This content is for educational and informational purposes only. It is not financial or investment advice. Cryptocurrency trading involves significant risk. Always do your own research and use proper risk management.
BTCUSD 
면책사항
해당 정보와 게시물은 금융, 투자, 트레이딩 또는 기타 유형의 조언이나 권장 사항으로 간주되지 않으며, 트레이딩뷰에서 제공하거나 보증하는 것이 아닙니다. 자세한 내용은 이용 약관을 참조하세요.
면책사항
해당 정보와 게시물은 금융, 투자, 트레이딩 또는 기타 유형의 조언이나 권장 사항으로 간주되지 않으며, 트레이딩뷰에서 제공하거나 보증하는 것이 아닙니다. 자세한 내용은 이용 약관을 참조하세요.