
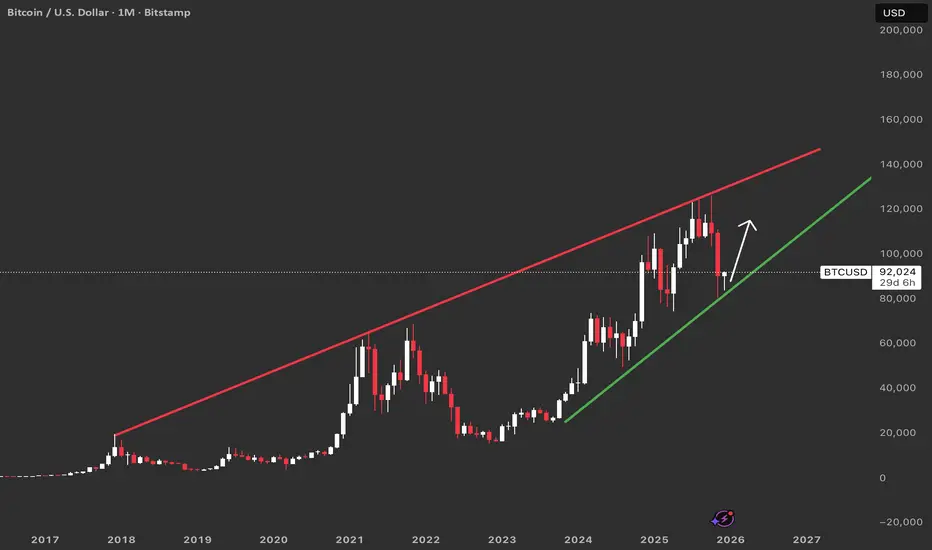
This monthly Bitcoin chart is on an arithmetic scale. The red line marks macro resistance connecting the major cycle peaks since 2017, forming the upper boundary of a large rising wedge, while the green line tracks macro support from the 2022 bear‑market low.
Price has recently pulled back from near the resistance and is now reacting around the support, showing that this trend channel is still respected on a closing‑basis. As long as monthly candles hold above the green line, the primary uptrend from the last bear‑market bottom remains intact and the wedge structure continues to guide expectations.
From this perspective, the chart suggests a path where Bitcoin can bounce off macro support and travel once more toward the resistance line before a larger cycle top and subsequent bear market.
This aligns with my main strategy that calls for a new high before the next major downturn.
Price has recently pulled back from near the resistance and is now reacting around the support, showing that this trend channel is still respected on a closing‑basis. As long as monthly candles hold above the green line, the primary uptrend from the last bear‑market bottom remains intact and the wedge structure continues to guide expectations.
From this perspective, the chart suggests a path where Bitcoin can bounce off macro support and travel once more toward the resistance line before a larger cycle top and subsequent bear market.
This aligns with my main strategy that calls for a new high before the next major downturn.

면책사항
해당 정보와 게시물은 금융, 투자, 트레이딩 또는 기타 유형의 조언이나 권장 사항으로 간주되지 않으며, 트레이딩뷰에서 제공하거나 보증하는 것이 아닙니다. 자세한 내용은 이용 약관을 참조하세요.
면책사항
해당 정보와 게시물은 금융, 투자, 트레이딩 또는 기타 유형의 조언이나 권장 사항으로 간주되지 않으며, 트레이딩뷰에서 제공하거나 보증하는 것이 아닙니다. 자세한 내용은 이용 약관을 참조하세요.