
BTC on the long-term chart is in a bullish pivot. See the image below.

The red lines are the resistance points that the crypto needs to overcome to reach the yellow lines (Targets).
On the medium-term chart, prices are also in an upward pivot. See image below.

Remember if. The red lines are resistance points.
In the short term I see a rise in drift. What a thing, right?

The bulls had better start acting, and push prices hard above 44.9K.
At the moment, the limiter is the 42K region. We had an accumulation that projects highs up to the mentioned range (42K).

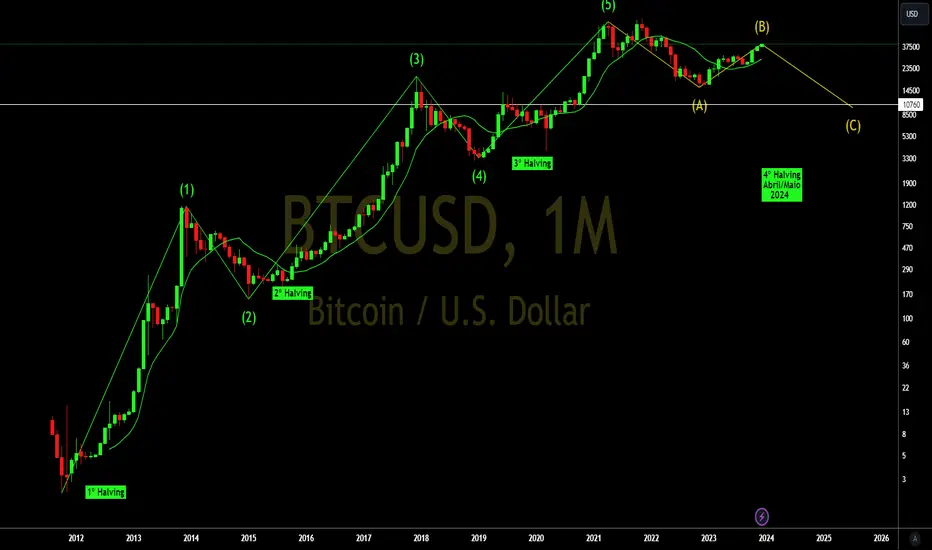
Below is an updated graphic image of the 12345ABC Elliott pattern! Don't get stuck in the past!

Do your analysis and good business.
Be aware, if you buy, use stop loss.
See other graphical analyzes below.
The red lines are the resistance points that the crypto needs to overcome to reach the yellow lines (Targets).
On the medium-term chart, prices are also in an upward pivot. See image below.
Remember if. The red lines are resistance points.
In the short term I see a rise in drift. What a thing, right?
The bulls had better start acting, and push prices hard above 44.9K.
At the moment, the limiter is the 42K region. We had an accumulation that projects highs up to the mentioned range (42K).
Below is an updated graphic image of the 12345ABC Elliott pattern! Don't get stuck in the past!
Do your analysis and good business.
Be aware, if you buy, use stop loss.
See other graphical analyzes below.

관련 발행물
면책사항
해당 정보와 게시물은 금융, 투자, 트레이딩 또는 기타 유형의 조언이나 권장 사항으로 간주되지 않으며, 트레이딩뷰에서 제공하거나 보증하는 것이 아닙니다. 자세한 내용은 이용 약관을 참조하세요.
면책사항
해당 정보와 게시물은 금융, 투자, 트레이딩 또는 기타 유형의 조언이나 권장 사항으로 간주되지 않으며, 트레이딩뷰에서 제공하거나 보증하는 것이 아닙니다. 자세한 내용은 이용 약관을 참조하세요.