
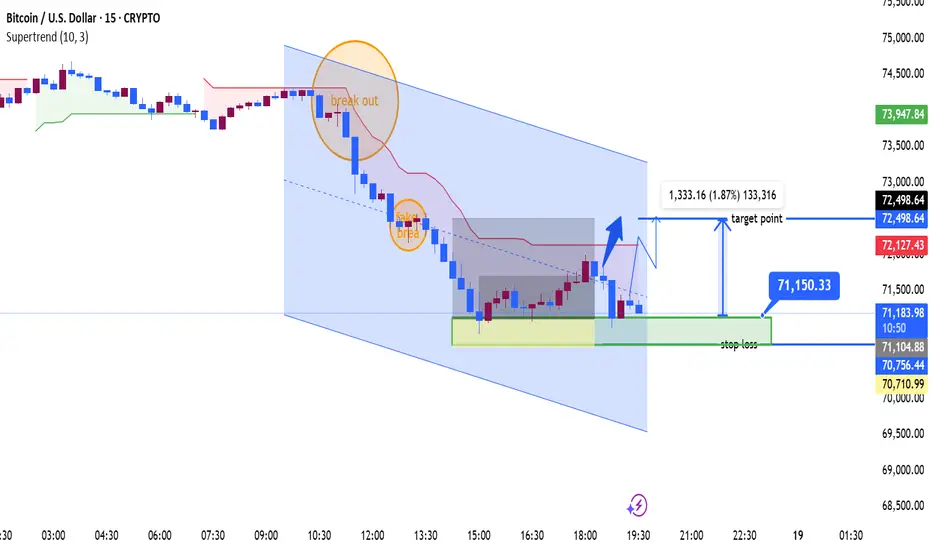
The market (Bitcoin / USD) is in a descending channel → clear short-term downtrend.
Price is respecting both:
Upper trendline (resistance)
Lower trendline (support)
⚠️ Key Signals on Your Chart
1. “Breakout” (actually a trap)
The marked breakout at the top failed quickly.
This is a classic bull trap → buyers entered, then price reversed sharply down.
2. “Fake break”
Midway down, there’s a fake breakdown / continuation signal.
Instead of reversing upward, price continued lower → confirms bearish momentum.
🟩 Current Situation (Important Zone)
Price is now sitting in a strong demand/support zone (~70.7k–71.3k).
This zone has:
Multiple touches (accumulation behavior)
A reaction bounce already
👉 This is why you marked a long setup
📊 Your Trade Idea (Long)
Entry
Around 71,150
Stop Loss
Below support (~70,700)
Good logic: below liquidity zone
Target
Around 72,500
Aligns with:
Channel mid/high
Prior resistance
Supertrend level
🧠 Trade Logic (Why it makes sense)
This is a counter-trend bounce trade, not a trend reversal:
✔ Oversold inside channel
✔ Strong horizontal support
✔ Potential short-term mean reversion
✔ Risk/Reward looks decent (~1.8%)
⚠️ Risks
You are trading against the trend (downtrend still intact)
If support breaks:
Price could quickly drop toward 69.5k–70k
No confirmed higher high yet → no real bullish structure
🔍 What You Should Watch Next
Bullish Confirmation
Break above 72,100–72,500
Strong candles + volume
Channel resistance test
Bearish Confirmation
Clean break below 70,700
Retest failure → continuation down
🧩 Simple Summary
Trend: Bearish
Setup: Support bounce (short-term long)
Bias: Cautiously bullish only inside support
Best play: Quick reaction trade, not swing hold

join my telegram channel t.me/goldsignalicthttps://t.me/goldsignalicthttps://t.me/goldsignalict
면책사항
해당 정보와 게시물은 금융, 투자, 트레이딩 또는 기타 유형의 조언이나 권장 사항으로 간주되지 않으며, 트레이딩뷰에서 제공하거나 보증하는 것이 아닙니다. 자세한 내용은 이용 약관을 참조하세요.
join my telegram channel t.me/goldsignalicthttps://t.me/goldsignalicthttps://t.me/goldsignalict
면책사항
해당 정보와 게시물은 금융, 투자, 트레이딩 또는 기타 유형의 조언이나 권장 사항으로 간주되지 않으며, 트레이딩뷰에서 제공하거나 보증하는 것이 아닙니다. 자세한 내용은 이용 약관을 참조하세요.