
Executive Summary
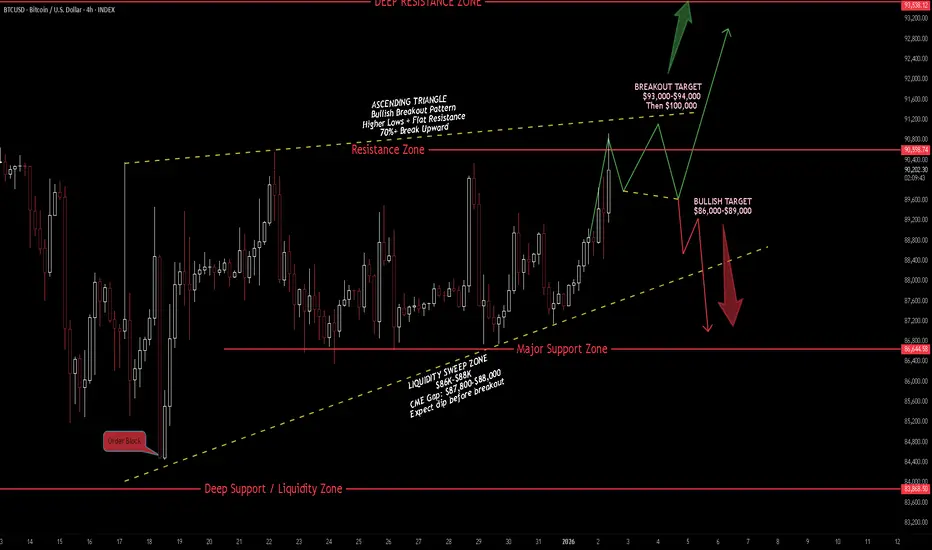
Bitcoin is trading at $90,529 on the first trading day of 2026, testing the upper resistance of an ascending triangle on the 4H timeframe. Price has rallied +2% today as dip buyers stepped in aggressively. The structure suggests a short-term pullback to sweep liquidity below $88K before breaking the ascending pattern and bursting higher.
BIAS: BULLISH - Short-Term Dip, Then Breakout
Current Market Data
- Current: $90,529 (+1.98%)
- Day's Range: $88,309 - $90,927
- October Peak: $126,000
- Key Support: $86,000-$88,000
- Fear & Greed Index: 36 (Fear → improving)
What's Driving the Rally
- "January Effect" - Tax-loss selling ended, capital redeploying
- Whale accumulation visible on-chain
- Open interest up 2% to $130B - leveraged bulls entering
- $217.82M in shorts liquidated in 24 hours
- Meme coins rallying (PEPE +32%) - risk-on returning
- Fed rate cuts expected by March
Key News Context
- Bitcoin's four-year cycle officially broken - first red post-halving year
- ETF effect pulled liquidity forward into 2024
- BlackRock deposited 1,134 BTC ($101.4M) to Binance - bearish signal
- But whales reducing exchange deposits - bullish signal
- Zero Bitcoin obituaries in 2025 - first time since Satoshi era
Technical Structure - 4H
Ascending Triangle Pattern:
- Rising support trendline (yellow dashed) - higher lows
- Horizontal resistance at $90,000-$90,500 (pink zone)
- Price compressing toward apex
- Typically bullish breakout pattern (70%+)
Key Levels:
Resistance:
- $90,000 - $90,500 - Horizontal resistance (pink zone)
- $93,000 - $93,200 - Upper target zone
- $100,000 - Psychological level
Support:
- $88,000 - CME gap zone ($87,800-$88,000)
- $86,000 - $86,500 - Major support zone (pink)
- $84,000 - $84,500 - Deep support / liquidity pool
Liquidity Analysis
- Heavy liquidation clusters below $88,000
- More intense bands near $86,000 and $84,500
- CME gap at $87,800-$88,000 - likely to be filled
- Thin resistance between $91,000-$94,000 if breakout occurs
SCENARIO ANALYSIS
PRIMARY: Liquidity Sweep Then Breakout
- Short-term dip to $86,000-$88,000 to sweep liquidity
- Fill CME gap at $87,800-$88,000
- Bounce off ascending trendline support
- Break above $90,500 resistance
- Target $93,000-$94,000, then $100,000
BULLISH: Direct Breakout
Trigger: 4H close above $90,500 with volume
Targets: $93,000 → $94,000 → $100,000
BEARISH: Triangle Breakdown
Trigger: Break below $86,000 and ascending trendline
Targets: $84,500 → $83,000 → $80,000
My Assessment
Ascending triangle at resistance with liquidity pools below. Expect short-term dip to sweep $86K-$88K liquidity, fill CME gap, then break ascending pattern and burst higher. Risk-on sentiment returning, whale accumulation, and January Effect support bullish thesis.
Strategy:
- Wait for dip to $86,000-$88,000 zone
- Long on bounce with stop below $84,500
- Target $93,000-$94,000, then $100,000
- Or long on confirmed breakout above $90,500
Drop your comments below on what you think is the NEXT MOVE!

The AI Trading Ecosystem, Built to win trades 📈
Get Full Access 👇
jackofalltrades.vip 🌐
t.me/jackofalltradesvip 🃏
Get Full Access 👇
jackofalltrades.vip 🌐
t.me/jackofalltradesvip 🃏
면책사항
해당 정보와 게시물은 금융, 투자, 트레이딩 또는 기타 유형의 조언이나 권장 사항으로 간주되지 않으며, 트레이딩뷰에서 제공하거나 보증하는 것이 아닙니다. 자세한 내용은 이용 약관을 참조하세요.
The AI Trading Ecosystem, Built to win trades 📈
Get Full Access 👇
jackofalltrades.vip 🌐
t.me/jackofalltradesvip 🃏
Get Full Access 👇
jackofalltrades.vip 🌐
t.me/jackofalltradesvip 🃏
면책사항
해당 정보와 게시물은 금융, 투자, 트레이딩 또는 기타 유형의 조언이나 권장 사항으로 간주되지 않으며, 트레이딩뷰에서 제공하거나 보증하는 것이 아닙니다. 자세한 내용은 이용 약관을 참조하세요.