
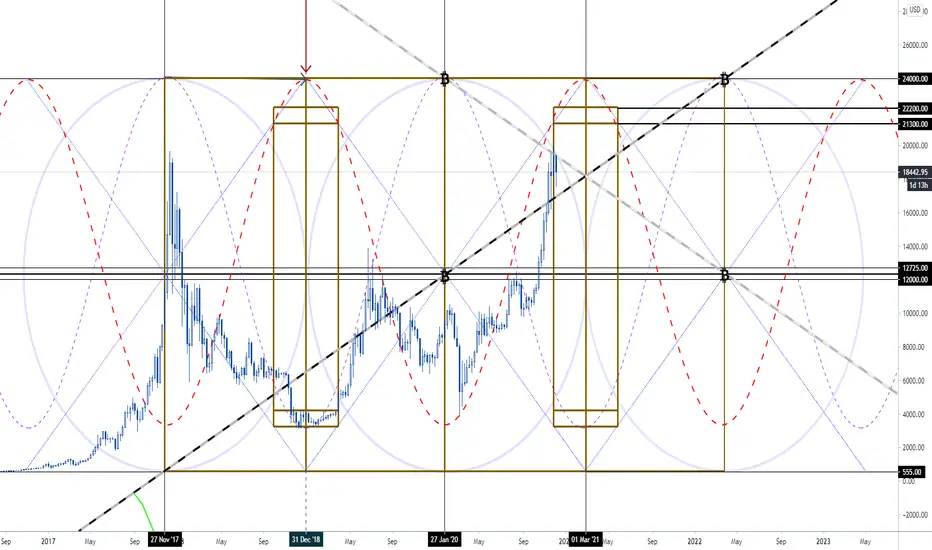
Using a hybrid drawing/indicator method to find center, mean, and tangents. From there, I found some interesting alignments and sine that capture the price repeatedly. Follow the price and use this as a tool to confirm your own interpretation. See how the price respects/crosses over/ breaks down as in interacts with the trends, vertical pivot lines, sine lines and levels. I'm big on balance and natural movement so these charts are great foundations for finding possible future price coordinates. Looks like a chance to climb to another ATH still remains but real volume and orders will be the deciding factor before the next major pivot is due. 

면책사항
해당 정보와 게시물은 금융, 투자, 트레이딩 또는 기타 유형의 조언이나 권장 사항으로 간주되지 않으며, 트레이딩뷰에서 제공하거나 보증하는 것이 아닙니다. 자세한 내용은 이용 약관을 참조하세요.
면책사항
해당 정보와 게시물은 금융, 투자, 트레이딩 또는 기타 유형의 조언이나 권장 사항으로 간주되지 않으며, 트레이딩뷰에서 제공하거나 보증하는 것이 아닙니다. 자세한 내용은 이용 약관을 참조하세요.