
After seeing hundreds of chart comparisons I decided to do one myself. My comparisons are simple price structures and trends. There are no counting of how many ups or downs, or how many percentages up or down, or the amount of time it took from one peak to the other. To me, none of that matters.
You can try to find a chart on any stock market, indices, Forex and you will eventually find a chart that looks similar. But how are you going to trade using the two charts that are similar? At what price are you going to enter your position? Where is your stop-loss and take profit level? Or are you just going to HODL like what you have been doing since Bitcoin was $20k and been crying to your Mumma every night since?
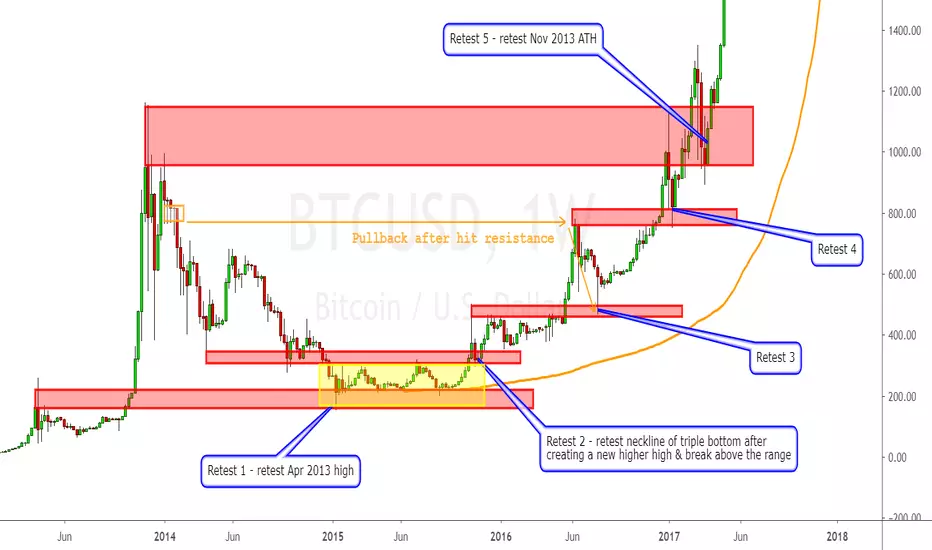
If you look back in 2015, Bitcoin first retested the high in April 2013 (Retest 1) and couldn’t break below it. Bitcoin then consolidated for a year before breaking above the neckline of the triple bottom. After it broke above the neckline it did a retest and confirmed the neckline as support (Retest 2). Then the same process repeats itself until, a support is no longer a support or a resistance is no longer a resistance. As you can see, I didn’t use any indicator like NVT, RSI, MACD, Elliott Waves or fractals because you don’t necessary need any of those indicators. Sometimes the best way to trading is to keep it simple - buy at support & sell at resistance.
If you’d like to see a new bull run to start in the next year or two, you really want to see Bitcoin starts to retrace soon and retest supports. Right now, there is FOMO everywhere, and what happens when there is FOMO? I am sure you know better than I do.
I will post my projections for 2019 after I believe a short-term high is in. Until then, sit tight and take profits on your long positions on the way up.
Taiwan Bear
You can try to find a chart on any stock market, indices, Forex and you will eventually find a chart that looks similar. But how are you going to trade using the two charts that are similar? At what price are you going to enter your position? Where is your stop-loss and take profit level? Or are you just going to HODL like what you have been doing since Bitcoin was $20k and been crying to your Mumma every night since?
If you look back in 2015, Bitcoin first retested the high in April 2013 (Retest 1) and couldn’t break below it. Bitcoin then consolidated for a year before breaking above the neckline of the triple bottom. After it broke above the neckline it did a retest and confirmed the neckline as support (Retest 2). Then the same process repeats itself until, a support is no longer a support or a resistance is no longer a resistance. As you can see, I didn’t use any indicator like NVT, RSI, MACD, Elliott Waves or fractals because you don’t necessary need any of those indicators. Sometimes the best way to trading is to keep it simple - buy at support & sell at resistance.
If you’d like to see a new bull run to start in the next year or two, you really want to see Bitcoin starts to retrace soon and retest supports. Right now, there is FOMO everywhere, and what happens when there is FOMO? I am sure you know better than I do.
I will post my projections for 2019 after I believe a short-term high is in. Until then, sit tight and take profits on your long positions on the way up.
Taiwan Bear

면책사항
해당 정보와 게시물은 금융, 투자, 트레이딩 또는 기타 유형의 조언이나 권장 사항으로 간주되지 않으며, 트레이딩뷰에서 제공하거나 보증하는 것이 아닙니다. 자세한 내용은 이용 약관을 참조하세요.
면책사항
해당 정보와 게시물은 금융, 투자, 트레이딩 또는 기타 유형의 조언이나 권장 사항으로 간주되지 않으며, 트레이딩뷰에서 제공하거나 보증하는 것이 아닙니다. 자세한 내용은 이용 약관을 참조하세요.