
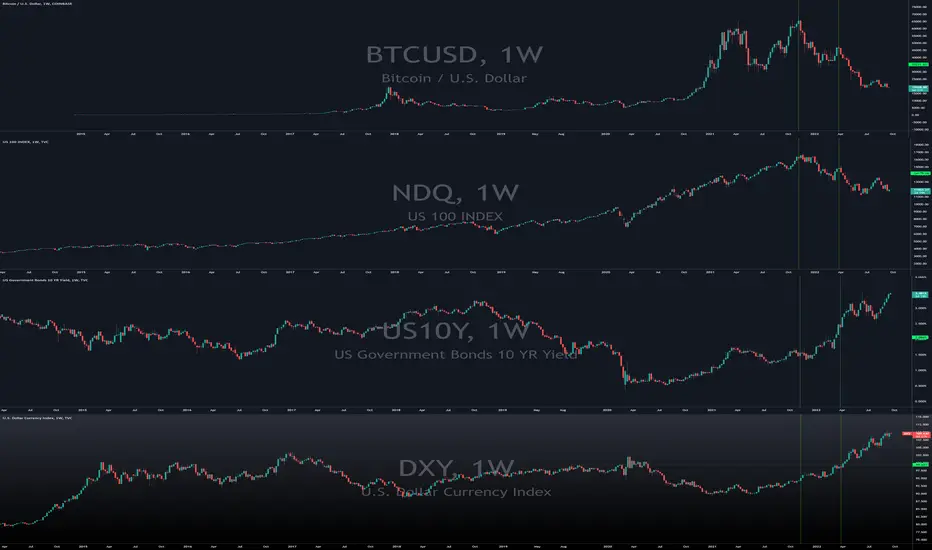
1st Vertical Line in bottom two charts show risk assets peaking such as Nasdaq and Bitcoin while the top two charts suggest a bottom confirmation by both US dollar and US 10 year treasury bills.
Horizontal line shows major penetration of support and/or resistance for all four charts. Penetration to the upside for top 2 charts, while penetration to the downside for risk assets.
2nd vertical line marks the point of penetration for support and/or resistance.
Why the strong correlation?
Market rotation from risk to safety and there's no other way to buy US treasury bills than to pay with US dollars.
Horizontal line shows major penetration of support and/or resistance for all four charts. Penetration to the upside for top 2 charts, while penetration to the downside for risk assets.
2nd vertical line marks the point of penetration for support and/or resistance.
Why the strong correlation?
Market rotation from risk to safety and there's no other way to buy US treasury bills than to pay with US dollars.

면책사항
해당 정보와 게시물은 금융, 투자, 트레이딩 또는 기타 유형의 조언이나 권장 사항으로 간주되지 않으며, 트레이딩뷰에서 제공하거나 보증하는 것이 아닙니다. 자세한 내용은 이용 약관을 참조하세요.
면책사항
해당 정보와 게시물은 금융, 투자, 트레이딩 또는 기타 유형의 조언이나 권장 사항으로 간주되지 않으며, 트레이딩뷰에서 제공하거나 보증하는 것이 아닙니다. 자세한 내용은 이용 약관을 참조하세요.