
Technical Analysis and Outlook:
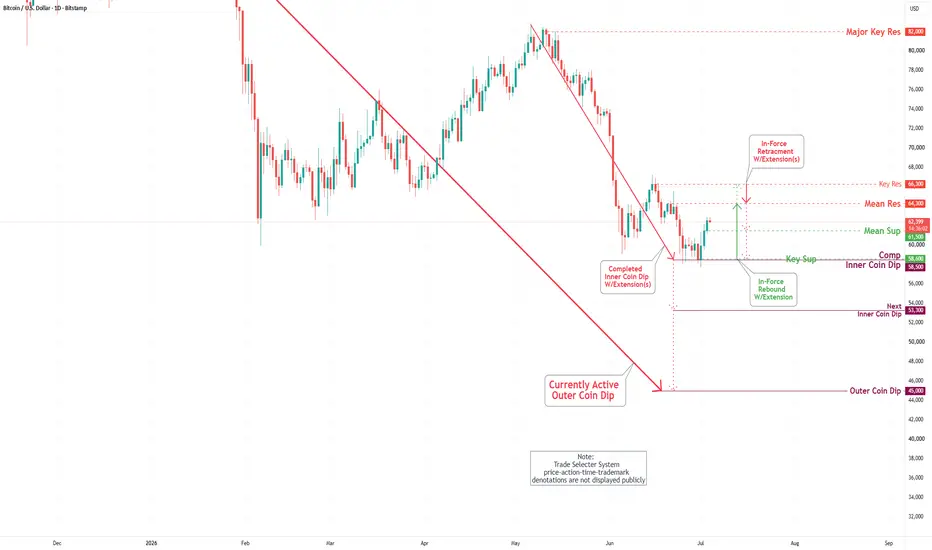
In the past week's trading session, Bitcoin has continued its upward trajectory after retesting the completed Inner Coin Dip at $58,500 and reaching the Mean Resistance at $61,800.
Currently, market analysis indicates a strong likelihood that Bitcoin will continue its ascent towards the Mean Resistance at $64,300, with the possibility of further progress reaching the upper target, the Key Resistance at $66,300.
Conversely, there is a risk that the cryptocurrency may experience an early reversal, retreating from the Mean Resistance at $64,300 to the Mean Support at $61,500. Such a decline could lead to a retest of the completed Inner Coin Dip at $58,500 and trigger an extension further to the subsequent Inner Coin Dip at $53,300, with the ultimate target being the Outer Coin Dip at $45,000.
In the past week's trading session, Bitcoin has continued its upward trajectory after retesting the completed Inner Coin Dip at $58,500 and reaching the Mean Resistance at $61,800.
Currently, market analysis indicates a strong likelihood that Bitcoin will continue its ascent towards the Mean Resistance at $64,300, with the possibility of further progress reaching the upper target, the Key Resistance at $66,300.
Conversely, there is a risk that the cryptocurrency may experience an early reversal, retreating from the Mean Resistance at $64,300 to the Mean Support at $61,500. Such a decline could lead to a retest of the completed Inner Coin Dip at $58,500 and trigger an extension further to the subsequent Inner Coin Dip at $53,300, with the ultimate target being the Outer Coin Dip at $45,000.

관련 발행물
면책사항
해당 정보와 게시물은 금융, 투자, 트레이딩 또는 기타 유형의 조언이나 권장 사항으로 간주되지 않으며, 트레이딩뷰에서 제공하거나 보증하는 것이 아닙니다. 자세한 내용은 이용 약관을 참조하세요.
면책사항
해당 정보와 게시물은 금융, 투자, 트레이딩 또는 기타 유형의 조언이나 권장 사항으로 간주되지 않으며, 트레이딩뷰에서 제공하거나 보증하는 것이 아닙니다. 자세한 내용은 이용 약관을 참조하세요.