
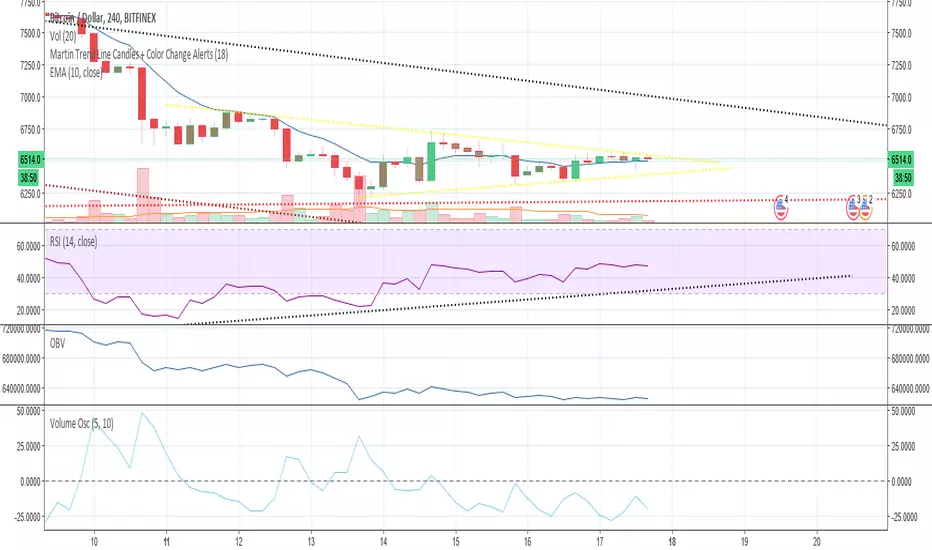
Based on the triangle's forming and local support areas, and the martin trendline indicator on the 4hr timeframe we are still bullish But will need to post chart screenshots to explain further.
TLDR; Looks like we're going to 68/6900 quickily.
TLDR; Looks like we're going to 68/6900 quickily.
노트
3HR Chart RSI and OBV trending up with martintrendline candles showing bullishing breakout likely.노트
2HR Timeframe trend in OBV and RSI more nmoticeable, more solid green candles on martin trndline in the oval highlight areas.노트
1HR Timeframe shows even more solid green candles lately, when seen inside the triangle points to a break upwards. As with most of the charts the highest volume spikes in the oscillator are around bullish movements.액티브 트레이드
30M Time frame shows very strong bullish pressure on with the martin trendline indicator. Id say long here to 6800 area maybe a small pull back to the lower triangle support. could go either way though. tight stop losses at $6484.노트
노트
Similar action to the last restest of the top of the parallel formed from the peak in December. Retest of the big triangle formed by the ATH. 노트
노트
Looking like this is invalid노트
Still can't tell if this is gonna go up or down.거래청산: 타겟 닿음
Went a smidge higher than i tought, touched $6850. Not sure how sustainable this rally is but id say we see at least a test of 7000 area.
관련 발행물
면책사항
해당 정보와 게시물은 금융, 투자, 트레이딩 또는 기타 유형의 조언이나 권장 사항으로 간주되지 않으며, 트레이딩뷰에서 제공하거나 보증하는 것이 아닙니다. 자세한 내용은 이용 약관을 참조하세요.
면책사항
해당 정보와 게시물은 금융, 투자, 트레이딩 또는 기타 유형의 조언이나 권장 사항으로 간주되지 않으며, 트레이딩뷰에서 제공하거나 보증하는 것이 아닙니다. 자세한 내용은 이용 약관을 참조하세요.