
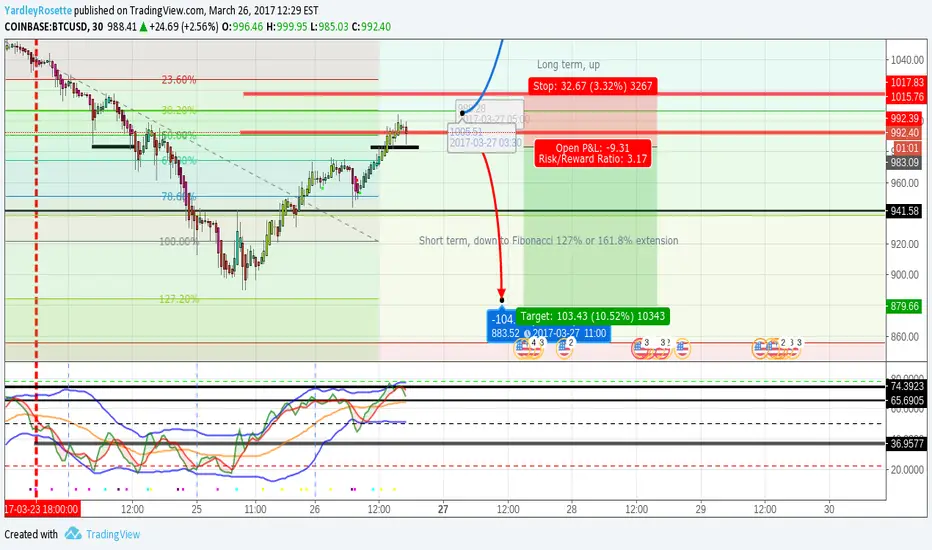
Long term, up.
Short term, down to Fibonacci 127% or 161.8% extension
Short term, down to Fibonacci 127% or 161.8% extension
노트
Traders Dynamic Index Indicator Alert v0.1 by JustUncleL, on realtime chart shows Red & Green move down to bounce on third line I placed on TDI indicator window & reversed up, as if a continuation of overall trend.This allows for a Fibonacci retracement to be placed:
A (0.00%) on low swing of 890,
B (100.00%) high swing of 1004.
From there see it as a retracement/pullback, & I see higher timeframe shows continuation signal up until it may again be considered overbought;
By using the Fibonacci tool, and placed it new, I can expect, that as a continuation, as described by the TDI indicator) it will lead to new 127.20% ($1,035) or 161.8% ($1,075)
노트
Specifically, price retraced to Fibonacci level of 61.8% (0.618) [$960] and continued up. {Foreseeing (127.20%) $1,035, or (161.8%) $1,075]
As sequence follows: 61.8% to 161.8%, & sometimes is rejected near 127.20%.
거래청산: 스탑 닿음
Did not fall below Fibonacci retracement level 78.6%.Price action pull-back at 50% but still continued uptrend, rather than the theorized reversal and appears to be an uptrend retracement.
78.6% would have been a better set entry (or 100%) once it was bounced off 50% I am suggesting to myself for future set-ups.

면책사항
해당 정보와 게시물은 금융, 투자, 트레이딩 또는 기타 유형의 조언이나 권장 사항으로 간주되지 않으며, 트레이딩뷰에서 제공하거나 보증하는 것이 아닙니다. 자세한 내용은 이용 약관을 참조하세요.
면책사항
해당 정보와 게시물은 금융, 투자, 트레이딩 또는 기타 유형의 조언이나 권장 사항으로 간주되지 않으며, 트레이딩뷰에서 제공하거나 보증하는 것이 아닙니다. 자세한 내용은 이용 약관을 참조하세요.