
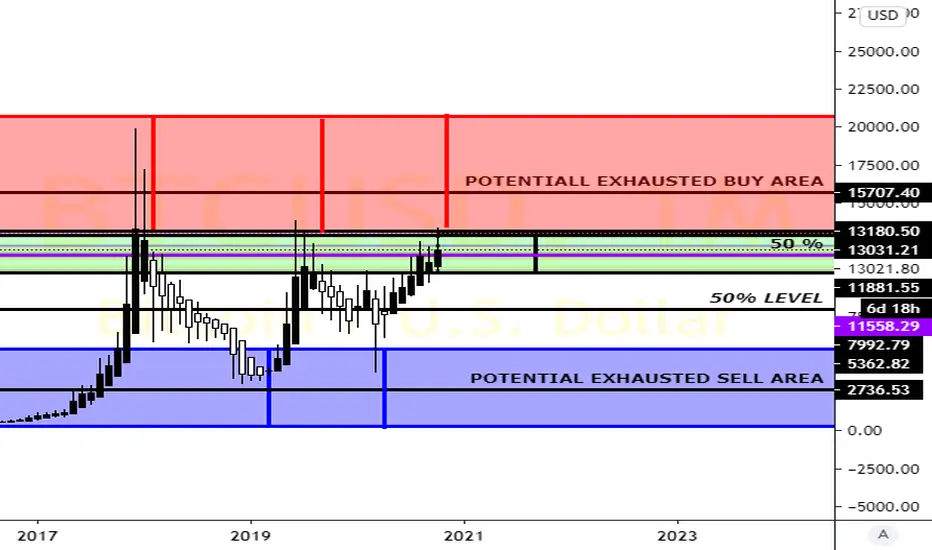
Bitcoin Monthly Analysis reveals key zones that are useful on lower timeframes.
When looking at this analysis you will identify 3 Key Areas: [
- An Exhausted Buy Area [ RED]
- An Exhausted Sell Area [ Blue ]
- 50% areas to identify breaks within the market using Gann and Fib:
* Breaks above = Buy and take to next zone
* Breaks below = Sell and take to next zone
Partial analysis:
Bitcoin has approach the Exhausted Buy Area in red. I am looking for price to reject!
Two of the indicators used would be a super trend to and DMI to identify trend reversal and momentum at zones.
Note: This just an idea and not a professional opinion.
Respectful Feedback would be kindly appreciated.
When looking at this analysis you will identify 3 Key Areas: [
- An Exhausted Buy Area [ RED]
- An Exhausted Sell Area [ Blue ]
- 50% areas to identify breaks within the market using Gann and Fib:
* Breaks above = Buy and take to next zone
* Breaks below = Sell and take to next zone
Partial analysis:
Bitcoin has approach the Exhausted Buy Area in red. I am looking for price to reject!
Two of the indicators used would be a super trend to and DMI to identify trend reversal and momentum at zones.
Note: This just an idea and not a professional opinion.
Respectful Feedback would be kindly appreciated.

면책사항
해당 정보와 게시물은 금융, 투자, 트레이딩 또는 기타 유형의 조언이나 권장 사항으로 간주되지 않으며, 트레이딩뷰에서 제공하거나 보증하는 것이 아닙니다. 자세한 내용은 이용 약관을 참조하세요.
면책사항
해당 정보와 게시물은 금융, 투자, 트레이딩 또는 기타 유형의 조언이나 권장 사항으로 간주되지 않으며, 트레이딩뷰에서 제공하거나 보증하는 것이 아닙니다. 자세한 내용은 이용 약관을 참조하세요.