
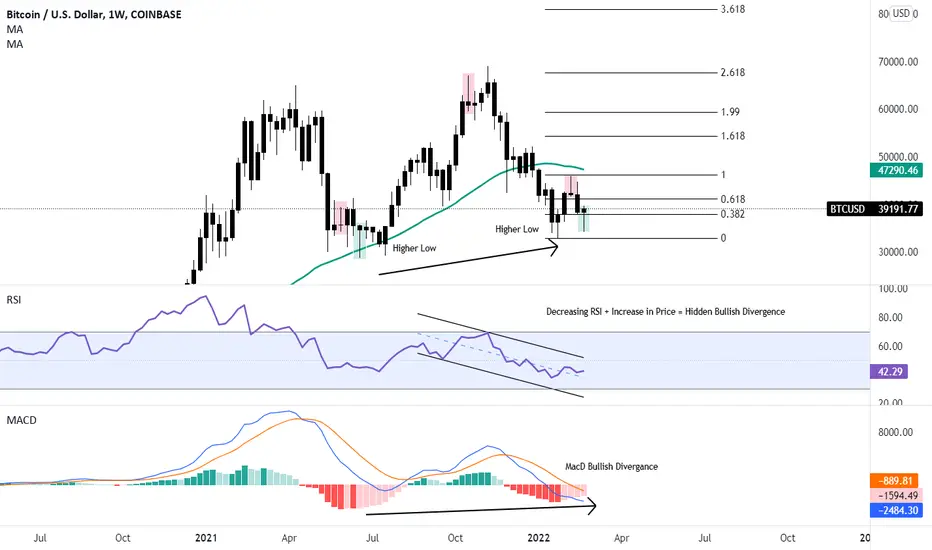
Chart
- BTC on the weekly timeframe. Weekly is not the strongest macro timeframe. Sometimes proves false signals.
Dragonfly / Gravestone Doji
- Highlighted in the green are the dragon fly doji's (recent signal doesn't close until Sunday)
- Highlighted in the red are the gravestone doji's
- Arguably the strongest significant Japanese Candle Stick for trend reversals.
Link: fxdayjob.com/dragonfly-and-gravestone-doji
RSI:
- Decreasing RSI + Increase in Price = Hidden Bullish Divergence
- Increasing RSI + Decrease in Price = Hidden Bearish Divergence
- Note that in summer of 2021 we had the same confluence in the chart.
MacD:
- Classic bullish divergence on the weekly.
- Note that bigger timeframes (Monthly, 2 week) are bearish.
Moving Averages:
- 50 Day $47,000
- 200 Day $20,000
Analysis:
- This is a high-risk trade b/c of current events.
- Fed is set to have a meeting regarding equities in March. (Likely to be very negative)
- I predict a further continuation rally here. May not bring us to ATH but, a recovery rally.
- Most importantly, do your own research. Strive to be a better trader every day.
- BTC on the weekly timeframe. Weekly is not the strongest macro timeframe. Sometimes proves false signals.
Dragonfly / Gravestone Doji
- Highlighted in the green are the dragon fly doji's (recent signal doesn't close until Sunday)
- Highlighted in the red are the gravestone doji's
- Arguably the strongest significant Japanese Candle Stick for trend reversals.
Link: fxdayjob.com/dragonfly-and-gravestone-doji
RSI:
- Decreasing RSI + Increase in Price = Hidden Bullish Divergence
- Increasing RSI + Decrease in Price = Hidden Bearish Divergence
- Note that in summer of 2021 we had the same confluence in the chart.
MacD:
- Classic bullish divergence on the weekly.
- Note that bigger timeframes (Monthly, 2 week) are bearish.
Moving Averages:
- 50 Day $47,000
- 200 Day $20,000
Analysis:
- This is a high-risk trade b/c of current events.
- Fed is set to have a meeting regarding equities in March. (Likely to be very negative)
- I predict a further continuation rally here. May not bring us to ATH but, a recovery rally.
- Most importantly, do your own research. Strive to be a better trader every day.

면책사항
해당 정보와 게시물은 금융, 투자, 트레이딩 또는 기타 유형의 조언이나 권장 사항으로 간주되지 않으며, 트레이딩뷰에서 제공하거나 보증하는 것이 아닙니다. 자세한 내용은 이용 약관을 참조하세요.
면책사항
해당 정보와 게시물은 금융, 투자, 트레이딩 또는 기타 유형의 조언이나 권장 사항으로 간주되지 않으며, 트레이딩뷰에서 제공하거나 보증하는 것이 아닙니다. 자세한 내용은 이용 약관을 참조하세요.