

Part 9: Next week looks set for a bullish TD Sequential 9 on the Weekly chart that hasn't been seen since July 2018. Back then this led to a 40% increase in the price of Bitcoin followed by 4 months of consolidation. This scenario is labeled "A". Extrapolation C is the inverse of the "bearish" TD 9 in April 2019 that led to a continuation of the bull trend. Hence, C is labeled as the "bullish" TD 9 but would be the most bearish scenario. Scenario B is the extrapolation of the 2018 wedge breakdown, as documented in Part 1 of the Bitcoin repeating history series.
The two year vpvr "average price" is referenced as a key level to break (and close) above at $8376.
If Bitcoin Repeats History?
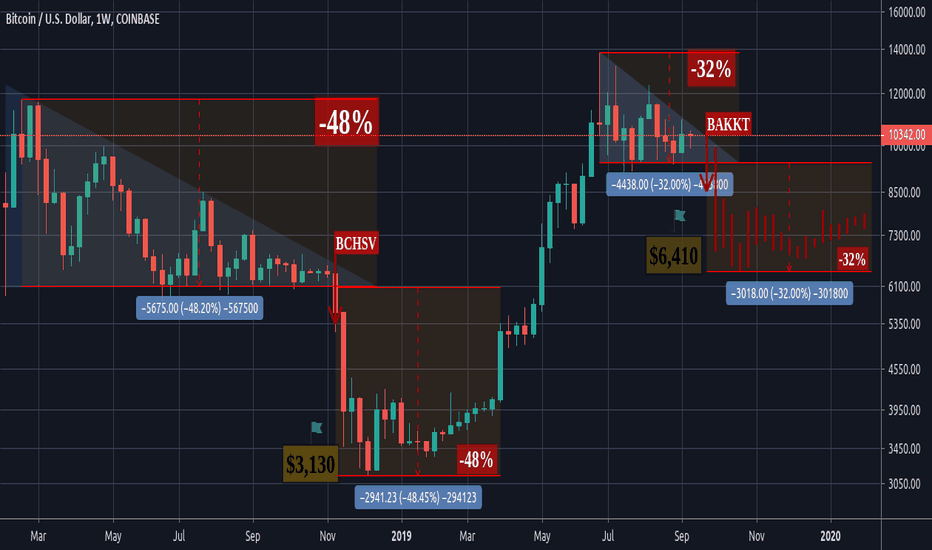
Part 1: Descending Triangle Looking Similar To 2018

Part 2: Measuring The Move of the Descending Triangle Breakdown
Part 3: A repeat of 2014? Worst Case Scenario A $2,500 Low

Part 4: If Bitcoin Repeats History? Extrapolating 2012 Breakdown

Part 5: If 2017 Descending Triangle Repeats? Best Case Scenario

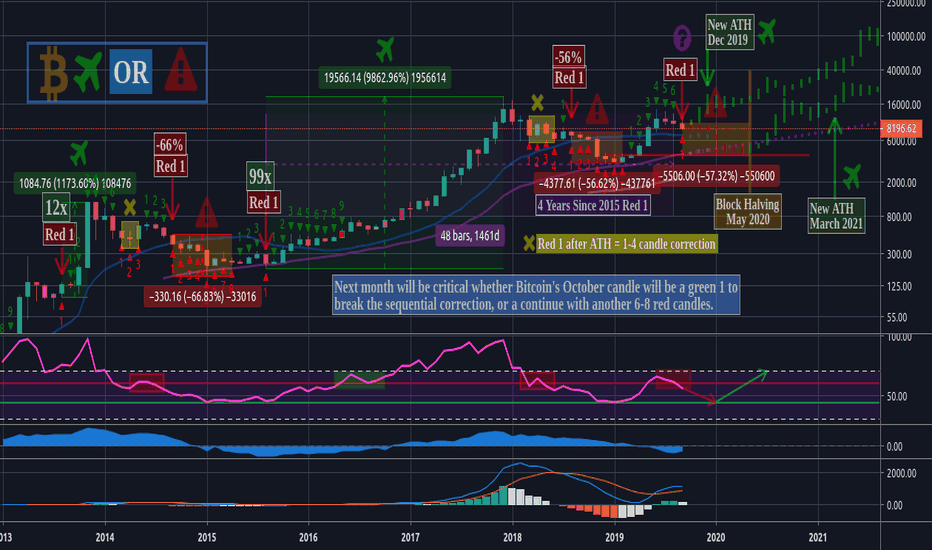
Part 6: If Bitcoin Repeats History? Monthly TD Sequential Red 1
Part 7: Another Bearish Indicator: 200 EMA & MA Bearcross

Part 8: Bitcoin's Full Moon Reversal 6 Month Pattern

The two year vpvr "average price" is referenced as a key level to break (and close) above at $8376.
If Bitcoin Repeats History?
Part 1: Descending Triangle Looking Similar To 2018
Part 2: Measuring The Move of the Descending Triangle Breakdown
Part 3: A repeat of 2014? Worst Case Scenario A $2,500 Low
Part 4: If Bitcoin Repeats History? Extrapolating 2012 Breakdown
Part 5: If 2017 Descending Triangle Repeats? Best Case Scenario
Part 6: If Bitcoin Repeats History? Monthly TD Sequential Red 1
Part 7: Another Bearish Indicator: 200 EMA & MA Bearcross
Part 8: Bitcoin's Full Moon Reversal 6 Month Pattern
노트
This is the sort of "big move" TD Sequential 9 I was anticipating.Now to see how the Week closes (bearish or bullsh TD 9).
노트
Part 10: Extrapolating the 50 & 200 Day MA bear crosses

관련 발행물
면책사항
해당 정보와 게시물은 금융, 투자, 트레이딩 또는 기타 유형의 조언이나 권장 사항으로 간주되지 않으며, 트레이딩뷰에서 제공하거나 보증하는 것이 아닙니다. 자세한 내용은 이용 약관을 참조하세요.
관련 발행물
면책사항
해당 정보와 게시물은 금융, 투자, 트레이딩 또는 기타 유형의 조언이나 권장 사항으로 간주되지 않으며, 트레이딩뷰에서 제공하거나 보증하는 것이 아닙니다. 자세한 내용은 이용 약관을 참조하세요.