
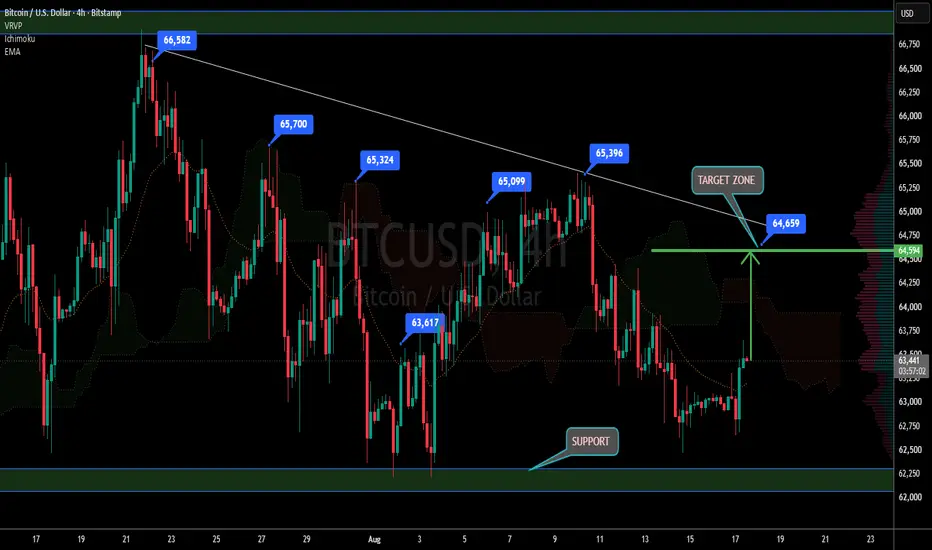
This is the Bitcoin / U.S. Dollar - BTCUSD 4-Hour chart on Bitstamp from TradingView.
Chart Analysis:
1. Range Play: BTC has been moving between a major SUPPORT zone at the bottom and a descending trendline at the top.
2. Previous Swings: Chart marks past highs: $66,588 → $63,700 → $64,114 → $64,999 → $65,344. Each lower high shows sellers were in control.
3. Current Move: After touching support, price bounced hard and is now heading up. Green arrow points to the TARGET ZONE around $64,000.
4. Structure: Still under the downtrend line. A break above it is needed to confirm trend reversal.
Key Levels to Watch:
- Support: Green zone at bottom ∼$60,000 - $60,500. Must hold for bullish case
- Target Zone: $64,000 - First major resistance + confluence with trendline
- Resistance: $65,300 - $66,600 area - Previous swing highs. Break here flips structure bullish
Bias: Bullish short-term while above support. If BTC breaks and closes 4H above $64,000 + trendline, next move is toward $65,300+. Rejection at $64K = pullback to support likely.
Educational only. Not financial advice. BTC is volatile - use SL.
액티브 트레이드
active 거래청산: 타겟 닿음
target hitt
t.me/+iZwBzq15KTM1Mzc0
join telegram for free signal on gold and different markets
t.me/+iZwBzq15KTM1Mzc0
join free telegram channel
join telegram for free signal on gold and different markets
t.me/+iZwBzq15KTM1Mzc0
join free telegram channel
관련 발행물
면책사항
해당 정보와 게시물은 금융, 투자, 트레이딩 또는 기타 유형의 조언이나 권장 사항으로 간주되지 않으며, 트레이딩뷰에서 제공하거나 보증하는 것이 아닙니다. 자세한 내용은 이용 약관을 참조하세요.
t.me/+iZwBzq15KTM1Mzc0
join telegram for free signal on gold and different markets
t.me/+iZwBzq15KTM1Mzc0
join free telegram channel
join telegram for free signal on gold and different markets
t.me/+iZwBzq15KTM1Mzc0
join free telegram channel
관련 발행물
면책사항
해당 정보와 게시물은 금융, 투자, 트레이딩 또는 기타 유형의 조언이나 권장 사항으로 간주되지 않으며, 트레이딩뷰에서 제공하거나 보증하는 것이 아닙니다. 자세한 내용은 이용 약관을 참조하세요.