
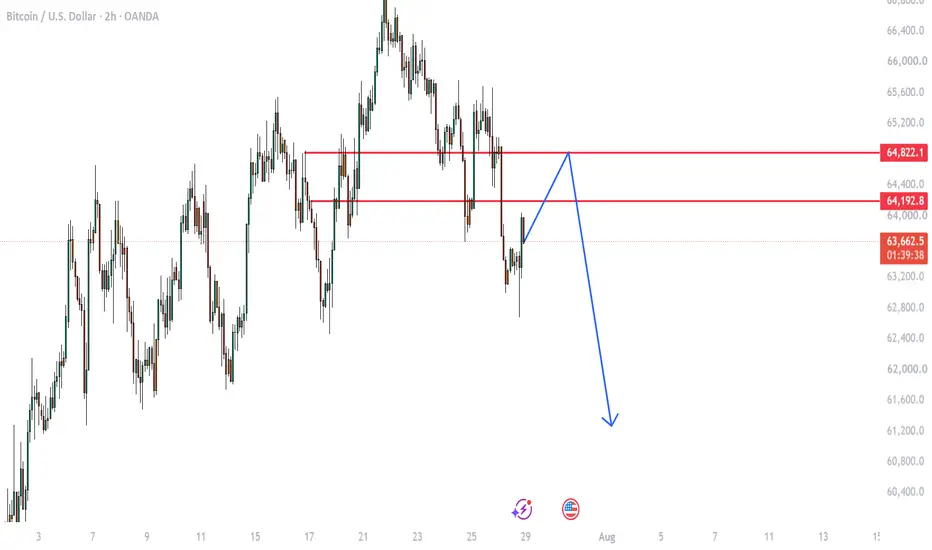
Bitcoin (BTC/USD) is approaching a key resistance zone between 64,192.8 and 64,822.1. If price rejects this area with bearish confirmation, sellers could regain control, increasing the probability of a decline toward the 61,200 region.
Key Levels:
🔴 Resistance 1: 64,192.8
🔴 Resistance 2: 64,822.1
🎯 Bearish Target: 61,200
Trade Idea:
Wait for a confirmed bearish rejection or market structure shift within the resistance zone before considering a sell trade. Use proper risk management and place your stop-loss above the resistance area.
Key Levels:
🔴 Resistance 1: 64,192.8
🔴 Resistance 2: 64,822.1
🎯 Bearish Target: 61,200
Trade Idea:
Wait for a confirmed bearish rejection or market structure shift within the resistance zone before considering a sell trade. Use proper risk management and place your stop-loss above the resistance area.

The Chart Core
면책사항
해당 정보와 게시물은 금융, 투자, 트레이딩 또는 기타 유형의 조언이나 권장 사항으로 간주되지 않으며, 트레이딩뷰에서 제공하거나 보증하는 것이 아닙니다. 자세한 내용은 이용 약관을 참조하세요.
The Chart Core
면책사항
해당 정보와 게시물은 금융, 투자, 트레이딩 또는 기타 유형의 조언이나 권장 사항으로 간주되지 않으며, 트레이딩뷰에서 제공하거나 보증하는 것이 아닙니다. 자세한 내용은 이용 약관을 참조하세요.