
Hi every one
Bitcoin / U.S. Dollar
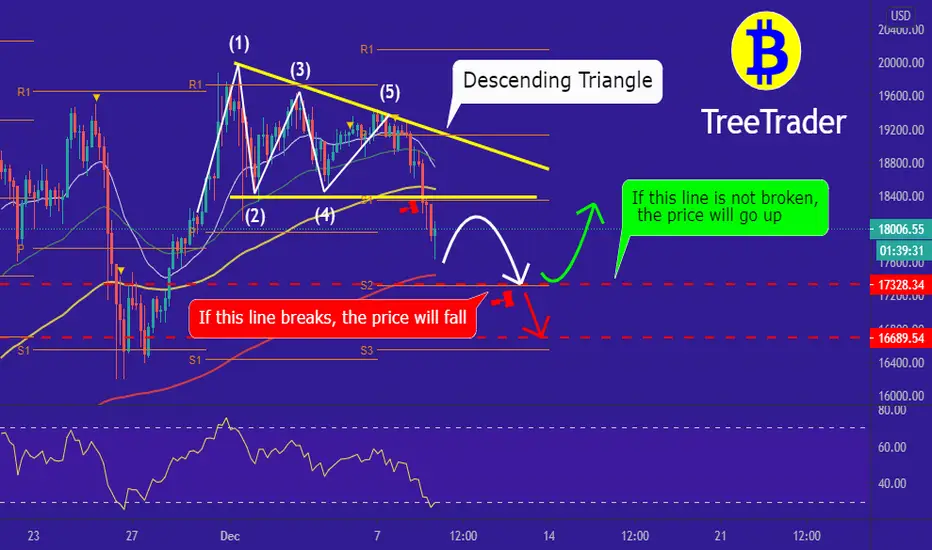
you can see the BTC/USD chart has broke the descending triangle which means the price has fallen also the Exponential Moving Average (EMA)200 and Pivot points (s2) are in a same spot so it is more likely that the price will reach that spot and make a pullback how ever if it reaches that spot and break it ,the price decrease dramatically!
we have dedicated a good amount of time for this analysis so support us by like and commenting our posts.
Things can change...
The markets are always changing and even with all these signals, the market changes tend to be strong and fast
Thank you for seeing idea .
Have a nice day and Good luck.
Bitcoin / U.S. Dollar
you can see the BTC/USD chart has broke the descending triangle which means the price has fallen also the Exponential Moving Average (EMA)200 and Pivot points (s2) are in a same spot so it is more likely that the price will reach that spot and make a pullback how ever if it reaches that spot and break it ,the price decrease dramatically!
we have dedicated a good amount of time for this analysis so support us by like and commenting our posts.
Things can change...
The markets are always changing and even with all these signals, the market changes tend to be strong and fast
Thank you for seeing idea .
Have a nice day and Good luck.
노트
My previous Analysis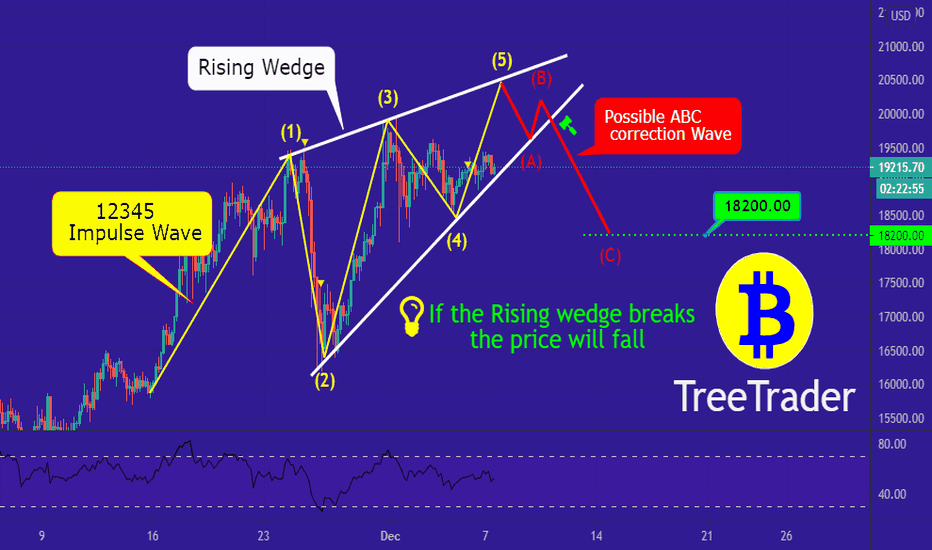
주문취소됨

관련 발행물
면책사항
해당 정보와 게시물은 금융, 투자, 트레이딩 또는 기타 유형의 조언이나 권장 사항으로 간주되지 않으며, 트레이딩뷰에서 제공하거나 보증하는 것이 아닙니다. 자세한 내용은 이용 약관을 참조하세요.
관련 발행물
면책사항
해당 정보와 게시물은 금융, 투자, 트레이딩 또는 기타 유형의 조언이나 권장 사항으로 간주되지 않으며, 트레이딩뷰에서 제공하거나 보증하는 것이 아닙니다. 자세한 내용은 이용 약관을 참조하세요.