
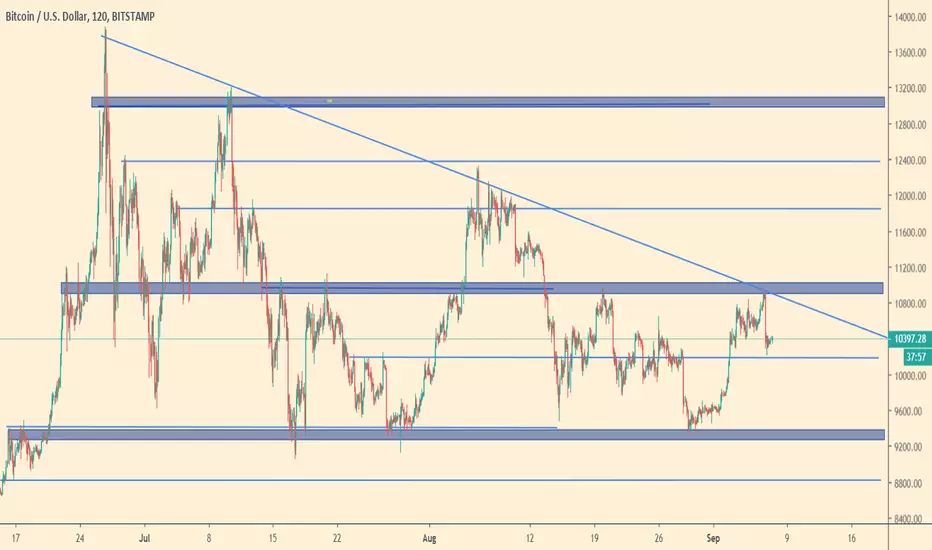
Bitcoin is forming a very large descending triangle, and has been doing it for more than 3 months.
Usually, descending triangles break downwards strongly. This is based on historical data. Now, if we look at the Bitcoin chart, it is very likely to get a larger pullback to $8,500-$8,750 due to the exponential increases had in June.
From The Copilot trading group, we expect the price to test $9,300 during the next week, and to break that evel downwards by the end of September.
Thereafter, there are very large demand zones at lower supports, like $8,700. That might be one of the latest occassions to buy BTC at that price.
Some traders also talk about even larger retracements to $7,000. This might happen, but very likely the demand will reject the price at those levels very quickly by pushing it up. ANd possibly, kicking off the next bull run.
The Copilot
Usually, descending triangles break downwards strongly. This is based on historical data. Now, if we look at the Bitcoin chart, it is very likely to get a larger pullback to $8,500-$8,750 due to the exponential increases had in June.
From The Copilot trading group, we expect the price to test $9,300 during the next week, and to break that evel downwards by the end of September.
Thereafter, there are very large demand zones at lower supports, like $8,700. That might be one of the latest occassions to buy BTC at that price.
Some traders also talk about even larger retracements to $7,000. This might happen, but very likely the demand will reject the price at those levels very quickly by pushing it up. ANd possibly, kicking off the next bull run.
The Copilot

면책사항
해당 정보와 게시물은 금융, 투자, 트레이딩 또는 기타 유형의 조언이나 권장 사항으로 간주되지 않으며, 트레이딩뷰에서 제공하거나 보증하는 것이 아닙니다. 자세한 내용은 이용 약관을 참조하세요.
면책사항
해당 정보와 게시물은 금융, 투자, 트레이딩 또는 기타 유형의 조언이나 권장 사항으로 간주되지 않으며, 트레이딩뷰에서 제공하거나 보증하는 것이 아닙니다. 자세한 내용은 이용 약관을 참조하세요.