
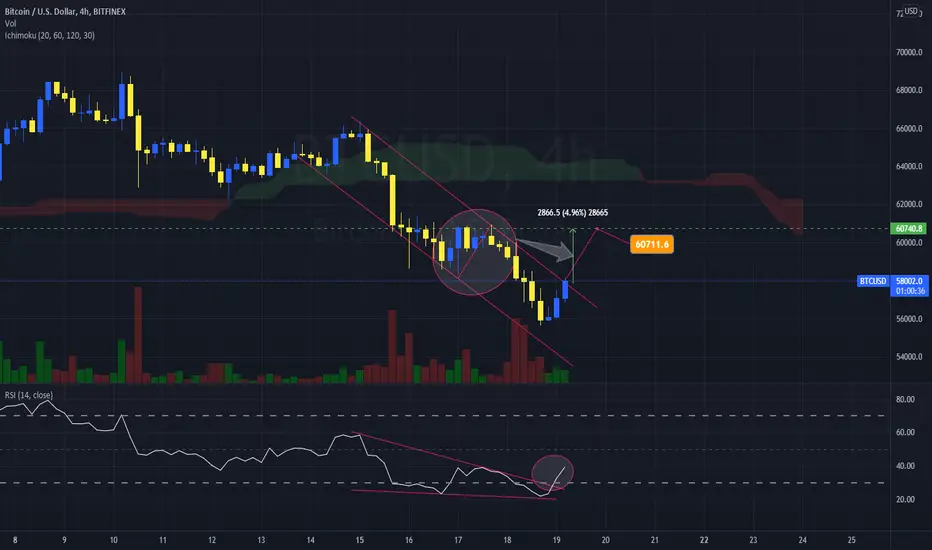
Hello friends, today I am reviewing the 4H chart for Bitcoin (BTC) on a linear scale.
In the chart I noted:
1) The price has been moving in a downward channel over the past days.
2) Currently, the price is attempting to break out of the channel with a measured move of about 5% to $60,711, where there prior period resistance.
3) The RSI has also broken out of a descending wedge it was forming. It is out of the oversold area now.
4) The Ichimoku Cloud is above us and though in the short term, price may go higher, the Ichimoku Cloud is showing that we may be headed further lower again.
What are your opinions on this?
If you enjoy my ideas, feel free to like it and drop in a comment. I love reading your comments below.
Disclosure: This is just my opinion and not any type of financial advice. I enjoy charting and discussing technical analysis. Don't trade based on my advice. Do your own research! #cryptopickk

관련 발행물
면책사항
해당 정보와 게시물은 금융, 투자, 트레이딩 또는 기타 유형의 조언이나 권장 사항으로 간주되지 않으며, 트레이딩뷰에서 제공하거나 보증하는 것이 아닙니다. 자세한 내용은 이용 약관을 참조하세요.
관련 발행물
면책사항
해당 정보와 게시물은 금융, 투자, 트레이딩 또는 기타 유형의 조언이나 권장 사항으로 간주되지 않으며, 트레이딩뷰에서 제공하거나 보증하는 것이 아닙니다. 자세한 내용은 이용 약관을 참조하세요.