
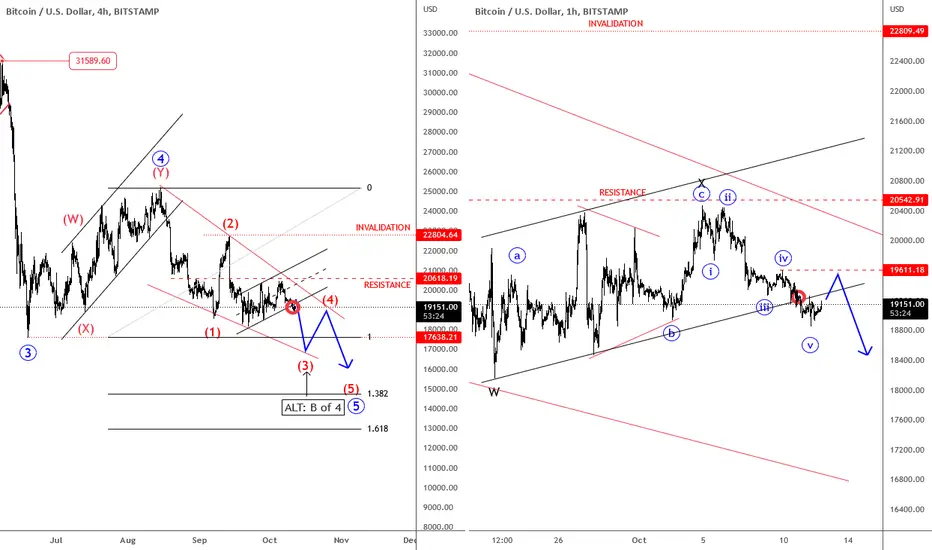
BTCUSD is coming sharply down in the 4-hour chart and seems like it's going to retest June lows within 5th wave after the recent complex corrective structure in wave 4. So, watch out for more weakness towards 17k-12k area, but maybe within a slower price action as part of the ending diagonal pattern for wave 5, unless it alternatively stays sideways within wave 4 bearish triangle formation.
On the hourly chart, we can also see five waves down from 20.600 resistance area, which suggests more downside in the near future, after any short-term rally.
On the hourly chart, we can also see five waves down from 20.600 resistance area, which suggests more downside in the near future, after any short-term rally.

Get the full Elliott Wave counts at WaveTraders, 14 days trial >> @ wavetraders.com/
Learn Elliott Waves Sale-65%
👉 wavetraders.com/academy/
Newsletter
👉 bit.ly/3FVPVzO
Learn Elliott Waves Sale-65%
👉 wavetraders.com/academy/
Newsletter
👉 bit.ly/3FVPVzO
관련 발행물
면책사항
해당 정보와 게시물은 금융, 투자, 트레이딩 또는 기타 유형의 조언이나 권장 사항으로 간주되지 않으며, 트레이딩뷰에서 제공하거나 보증하는 것이 아닙니다. 자세한 내용은 이용 약관을 참조하세요.
Get the full Elliott Wave counts at WaveTraders, 14 days trial >> @ wavetraders.com/
Learn Elliott Waves Sale-65%
👉 wavetraders.com/academy/
Newsletter
👉 bit.ly/3FVPVzO
Learn Elliott Waves Sale-65%
👉 wavetraders.com/academy/
Newsletter
👉 bit.ly/3FVPVzO
관련 발행물
면책사항
해당 정보와 게시물은 금융, 투자, 트레이딩 또는 기타 유형의 조언이나 권장 사항으로 간주되지 않으며, 트레이딩뷰에서 제공하거나 보증하는 것이 아닙니다. 자세한 내용은 이용 약관을 참조하세요.