
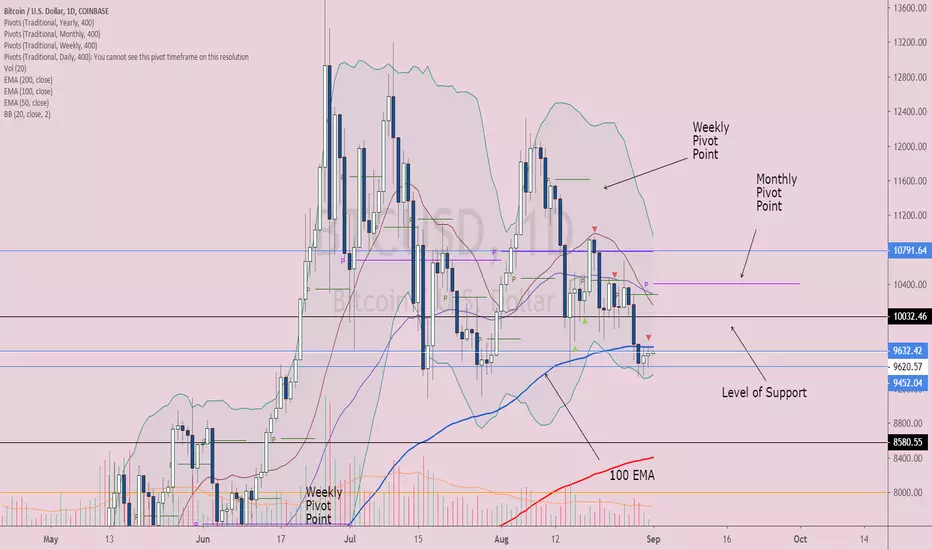
The market is showing signs of a possible bullish reversal of the current downward trend. The volume in the market isn’t supporting further downward motion and prices looks like it’s going to rebound.
Looking at candlestick patterns on the daily chart we have tweezer bottoms and a spinning top formations that are both reversal patterns.If we add in the Bollinger Band indicator we see that we are near the bottom of the band and there is not enough volume to allow for a further breakout in price below.
Next price actions that would validate a bullish reversal would be for the daily to close above the 100 EMA followed by closing above 10,000 and then being able to break through and close above a band of resistance from 10,000 to 10,400 taking out the new monthly pivot point.
Looking at candlestick patterns on the daily chart we have tweezer bottoms and a spinning top formations that are both reversal patterns.If we add in the Bollinger Band indicator we see that we are near the bottom of the band and there is not enough volume to allow for a further breakout in price below.
Next price actions that would validate a bullish reversal would be for the daily to close above the 100 EMA followed by closing above 10,000 and then being able to break through and close above a band of resistance from 10,000 to 10,400 taking out the new monthly pivot point.

면책사항
해당 정보와 게시물은 금융, 투자, 트레이딩 또는 기타 유형의 조언이나 권장 사항으로 간주되지 않으며, 트레이딩뷰에서 제공하거나 보증하는 것이 아닙니다. 자세한 내용은 이용 약관을 참조하세요.
면책사항
해당 정보와 게시물은 금융, 투자, 트레이딩 또는 기타 유형의 조언이나 권장 사항으로 간주되지 않으며, 트레이딩뷰에서 제공하거나 보증하는 것이 아닙니다. 자세한 내용은 이용 약관을 참조하세요.