
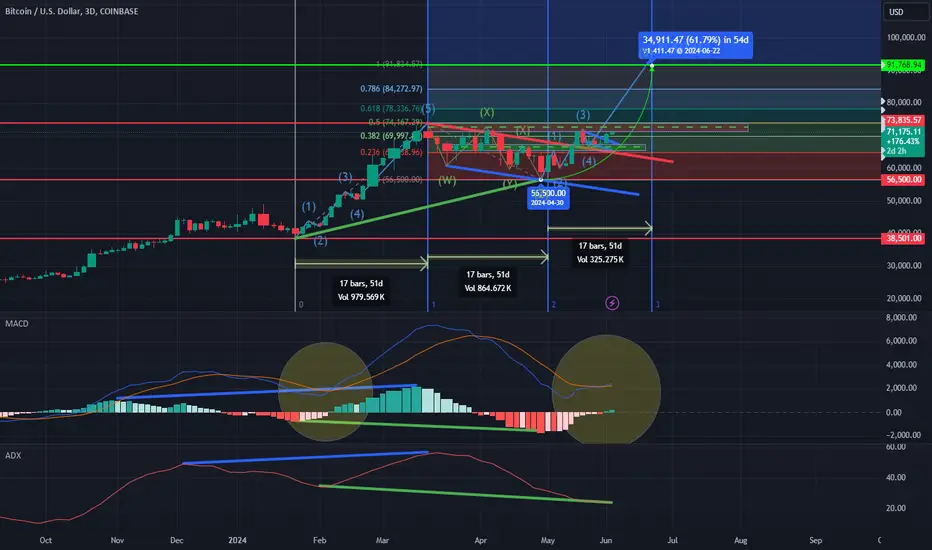
Bitcoin is currently $71,200, and is encountering resistance between $71,180 and $74,000.
I used the Fib Time Zone tool, in combination with Elliot Waves to further clarify the beginning and the end of a bullish or a bearish trend. Coincidently, the time it took for the last two wave to play out was exactly the same (17 days). Bitcoin is in an uptrend at the moment, and as shown on my chart, recently broke above a downwards sloping trendline (Red) -retested it and confirmed as support.
The MACD indicator turned bullish after the retest of the trend-line.
I believe that bitcoins price will continue to rise, as it completes the 5th Elliot impulsive wave. If the price can break above $74,200, I predict a new high between $84,250 and $91,750. If Bitcoin is rejected at $74,200, a retest of $65,000 would be likely.
노트
Also, There was a hidden bullish divergence on both the MACD, and ADX indicators. This shows that the current trend is supported by the underlying momentum.
면책사항
해당 정보와 게시물은 금융, 투자, 트레이딩 또는 기타 유형의 조언이나 권장 사항으로 간주되지 않으며, 트레이딩뷰에서 제공하거나 보증하는 것이 아닙니다. 자세한 내용은 이용 약관을 참조하세요.
면책사항
해당 정보와 게시물은 금융, 투자, 트레이딩 또는 기타 유형의 조언이나 권장 사항으로 간주되지 않으며, 트레이딩뷰에서 제공하거나 보증하는 것이 아닙니다. 자세한 내용은 이용 약관을 참조하세요.