
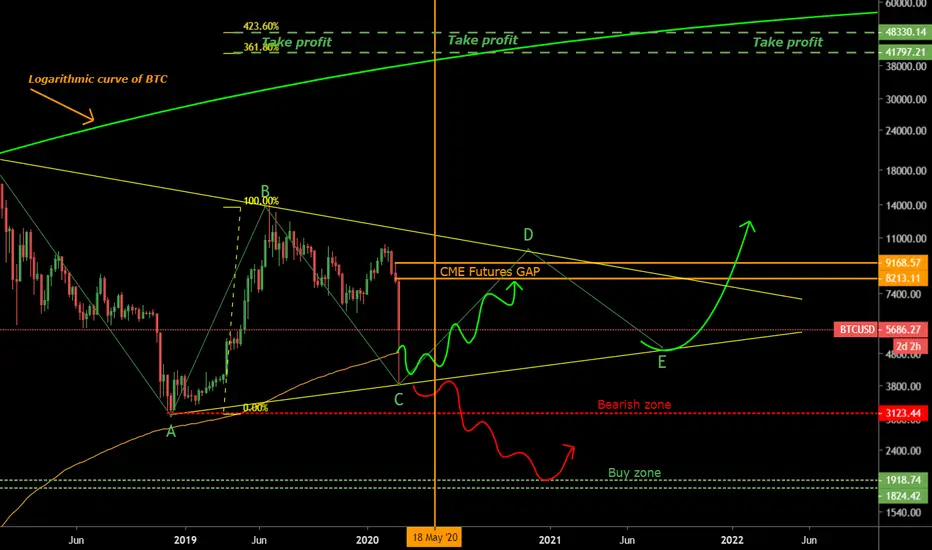
I am currently watching two possible scenarios at bitcoin. The first bullish scenario is a large triangle, which I talked about in the big BTC prediction for 2020. The point is that we must not get below the last local minimum, 3123$. Dump in the last two days was huge but reaction from Bulls was pretty nice. After such large price fluctuations, the chart should be relaxed, the indicators should have neutral zones, and traders should gain strength before moving. Therefore, I am not surprised if the BTC would go sideways for a month. As it begins to outperform its trend targets, the market begins to look optimistic and BTC by anticipating a price effect of approximately 9100$ to fill the important CME Futures GAP.
The Bearish scenario occurs when we come under the marked Bearish zone. The chart will include a minimum and look for a new stepping stone that leads to strong 1900$ to 1800$ support. If you want this scenario to be fulfilled, the natural development of the graph will be used according to your own analysis.
The Bearish scenario occurs when we come under the marked Bearish zone. The chart will include a minimum and look for a new stepping stone that leads to strong 1900$ to 1800$ support. If you want this scenario to be fulfilled, the natural development of the graph will be used according to your own analysis.

관련 발행물
면책사항
해당 정보와 게시물은 금융, 투자, 트레이딩 또는 기타 유형의 조언이나 권장 사항으로 간주되지 않으며, 트레이딩뷰에서 제공하거나 보증하는 것이 아닙니다. 자세한 내용은 이용 약관을 참조하세요.
관련 발행물
면책사항
해당 정보와 게시물은 금융, 투자, 트레이딩 또는 기타 유형의 조언이나 권장 사항으로 간주되지 않으며, 트레이딩뷰에서 제공하거나 보증하는 것이 아닙니다. 자세한 내용은 이용 약관을 참조하세요.