
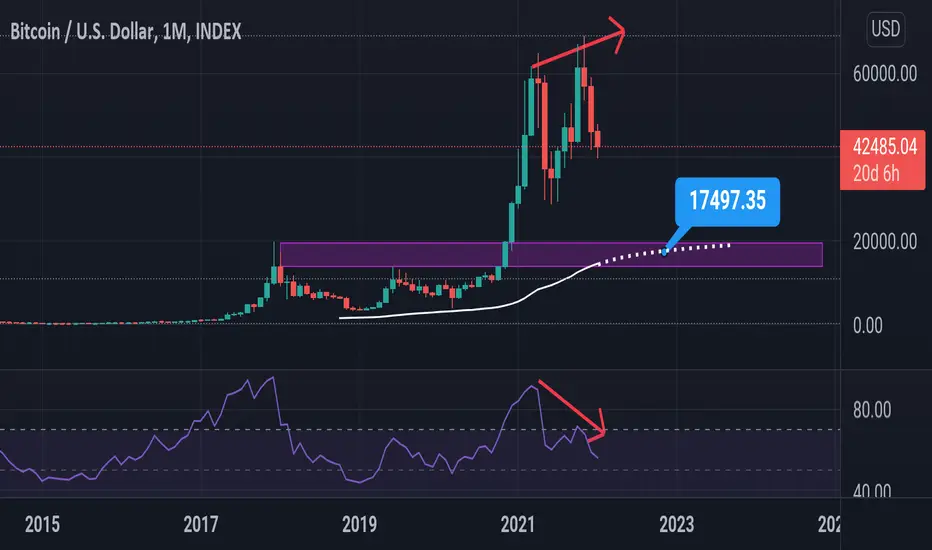
Look at the monthly timeframe
What do you see? Higher timeframes never lie and they're very simple to understand! We see a double top around 60_70K which is a very strong resistance also we see a bearish divergence because as price making higher highs RSI making lower highs also RSI is overbought. There's a support around 18_13K and also 100 monthly EMA is exactly there to support the price in future. These are very simple and obvious. Now you look at the chart and tell me what do you expect from bitcoin?
What do you see? Higher timeframes never lie and they're very simple to understand! We see a double top around 60_70K which is a very strong resistance also we see a bearish divergence because as price making higher highs RSI making lower highs also RSI is overbought. There's a support around 18_13K and also 100 monthly EMA is exactly there to support the price in future. These are very simple and obvious. Now you look at the chart and tell me what do you expect from bitcoin?
노트
As you see guys higher timeframes never lie. When we're bearish in higher timeframes it means indeed we're bearish in longterm.17K is in sight.

관련 발행물
면책사항
해당 정보와 게시물은 금융, 투자, 트레이딩 또는 기타 유형의 조언이나 권장 사항으로 간주되지 않으며, 트레이딩뷰에서 제공하거나 보증하는 것이 아닙니다. 자세한 내용은 이용 약관을 참조하세요.
면책사항
해당 정보와 게시물은 금융, 투자, 트레이딩 또는 기타 유형의 조언이나 권장 사항으로 간주되지 않으며, 트레이딩뷰에서 제공하거나 보증하는 것이 아닙니다. 자세한 내용은 이용 약관을 참조하세요.