
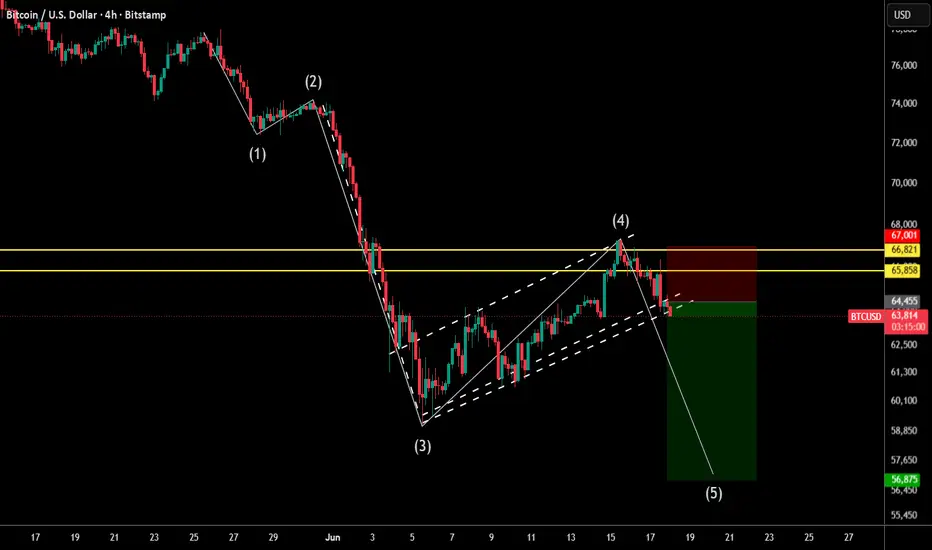
The recent price action in Bitcoin can be interpreted through an Elliott Wave framework, where the market appears to be developing a five-wave impulsive sequence to the downside.
The initial decline from the late-May highs can be labeled as Wave (1), followed by a corrective Wave (2) retracement. The subsequent selloff into the June lows represents an extended Wave (3), which is consistent with Elliott Wave theory, as third waves tend to be the strongest and most directional portion of the trend.
Following the Wave (3) low, BTC entered a corrective recovery phase that unfolded within a rising channel, culminating near the $66,000–$67,000 resistance zone. This rebound appears consistent with a developing Wave (4) correction, which has now encountered significant overhead supply and failed to reclaim key resistance levels.
More importantly, price is beginning to break below the lower boundary of the corrective structure, suggesting that Wave (4) may have completed. If this interpretation is correct, the market could be entering Wave (5), the final impulsive leg of the sequence.
Under this scenario, a sustained break below the $63,500–$64,000 support zone would likely accelerate downside momentum, opening the path toward the $57,000 region, which aligns with both prior support and the projected target derived from the wave structure.

관련 발행물
면책사항
해당 정보와 게시물은 금융, 투자, 트레이딩 또는 기타 유형의 조언이나 권장 사항으로 간주되지 않으며, 트레이딩뷰에서 제공하거나 보증하는 것이 아닙니다. 자세한 내용은 이용 약관을 참조하세요.
면책사항
해당 정보와 게시물은 금융, 투자, 트레이딩 또는 기타 유형의 조언이나 권장 사항으로 간주되지 않으며, 트레이딩뷰에서 제공하거나 보증하는 것이 아닙니다. 자세한 내용은 이용 약관을 참조하세요.