
My last update contained a short-term Triangle pattern setup with target area 1670-1689. The strategy I suggested was going long just above Wave D of Triangle with a stop-loss near Wave E bottom. 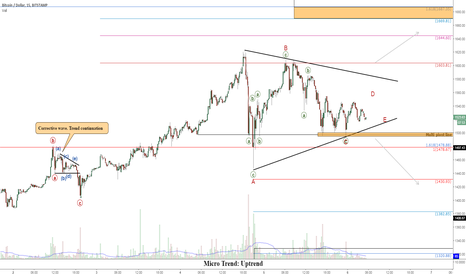
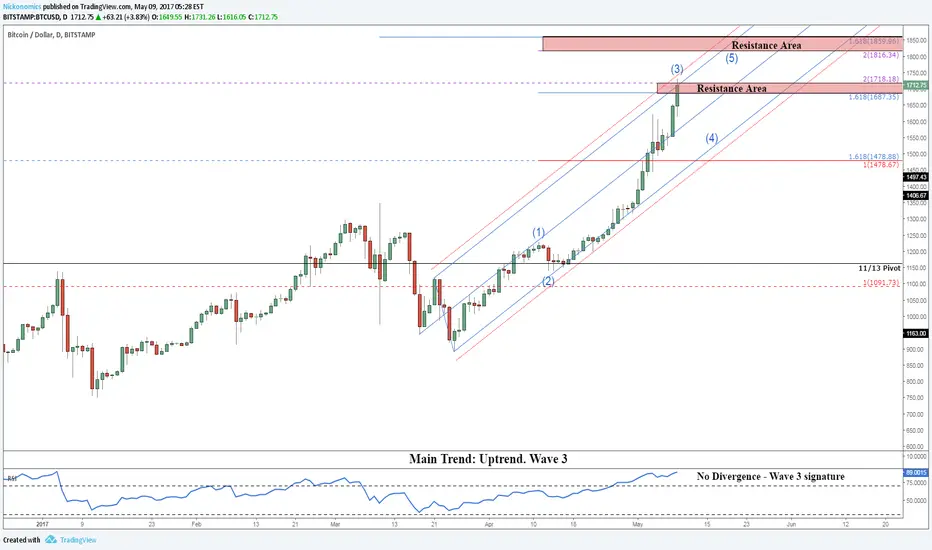
Everything went quite smoothly with prices breaking to $1720-s highs. Now it's time to switch to a longer-term chart and assess the trend pattern. According to my wave model, the price is still in Wave 3. Fibo ratios and no divergence RSI pattern support this idea. There are 2 resistance areas where this wave could end.
Intraday chart looks like this:
__
Video update: goo.gl/VZWlGH (Russian)
Everything went quite smoothly with prices breaking to $1720-s highs. Now it's time to switch to a longer-term chart and assess the trend pattern. According to my wave model, the price is still in Wave 3. Fibo ratios and no divergence RSI pattern support this idea. There are 2 resistance areas where this wave could end.
Intraday chart looks like this:
__
Video update: goo.gl/VZWlGH (Russian)
노트
Alternative wave count:
관련 발행물
면책사항
해당 정보와 게시물은 금융, 투자, 트레이딩 또는 기타 유형의 조언이나 권장 사항으로 간주되지 않으며, 트레이딩뷰에서 제공하거나 보증하는 것이 아닙니다. 자세한 내용은 이용 약관을 참조하세요.
관련 발행물
면책사항
해당 정보와 게시물은 금융, 투자, 트레이딩 또는 기타 유형의 조언이나 권장 사항으로 간주되지 않으며, 트레이딩뷰에서 제공하거나 보증하는 것이 아닙니다. 자세한 내용은 이용 약관을 참조하세요.