
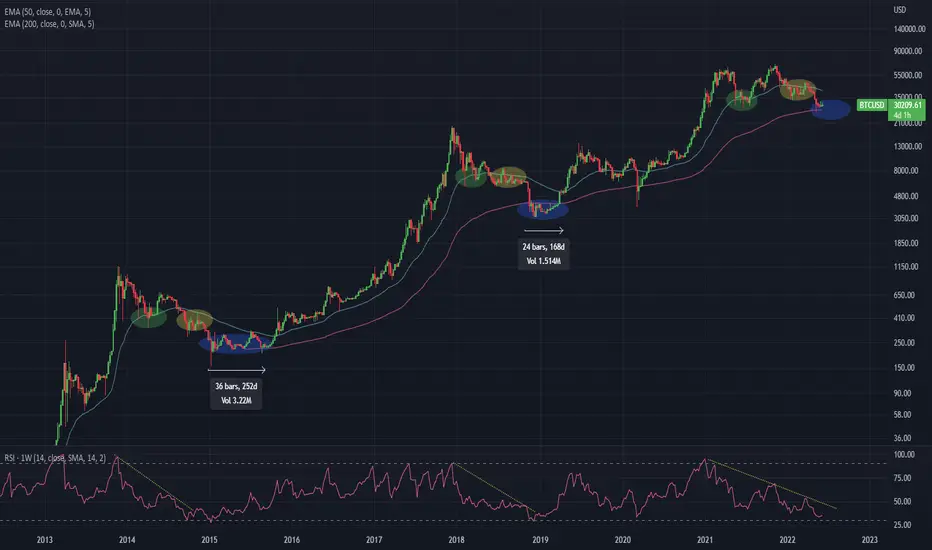
Patterns from other cycles seem to be repeating themselves today.
After each ATH of each cycle, the price heads towards the blue area where the EMA50 is, making a support.
When it breaks the EMA50, the price goes back to the average in the yellow area but this time it makes the EMA50 as resistance.
Finally, the price fails to break the resistance and finds the SMA200 and stops falling in the blue area, the accumulation area, where historically it was the best zone to buy.
Bitcoin goes back up and hits a new ATH and the cycle repeats.
It worked so far, but several external factors can influence some values, so don't take my analysis for granted
After each ATH of each cycle, the price heads towards the blue area where the EMA50 is, making a support.
When it breaks the EMA50, the price goes back to the average in the yellow area but this time it makes the EMA50 as resistance.
Finally, the price fails to break the resistance and finds the SMA200 and stops falling in the blue area, the accumulation area, where historically it was the best zone to buy.
Bitcoin goes back up and hits a new ATH and the cycle repeats.
It worked so far, but several external factors can influence some values, so don't take my analysis for granted

면책사항
해당 정보와 게시물은 금융, 투자, 트레이딩 또는 기타 유형의 조언이나 권장 사항으로 간주되지 않으며, 트레이딩뷰에서 제공하거나 보증하는 것이 아닙니다. 자세한 내용은 이용 약관을 참조하세요.
면책사항
해당 정보와 게시물은 금융, 투자, 트레이딩 또는 기타 유형의 조언이나 권장 사항으로 간주되지 않으며, 트레이딩뷰에서 제공하거나 보증하는 것이 아닙니다. 자세한 내용은 이용 약관을 참조하세요.