
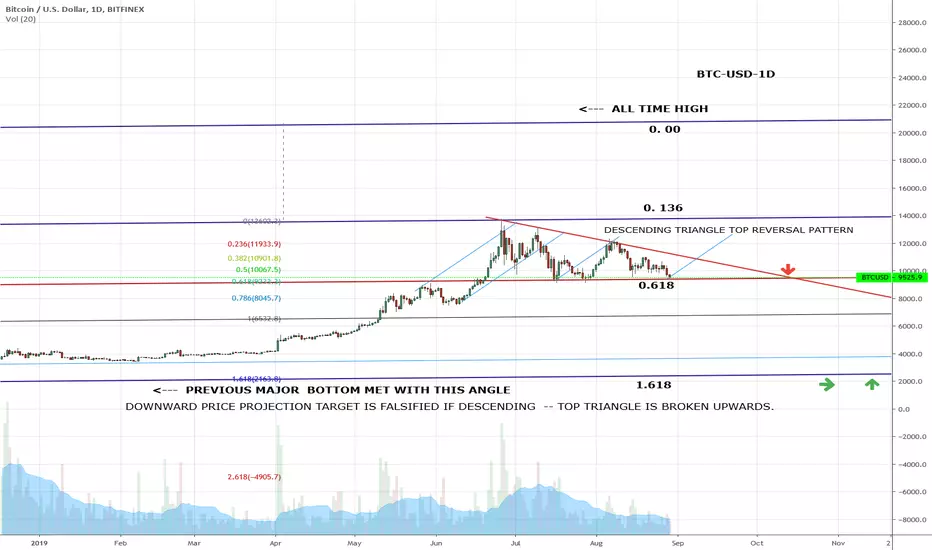
The slightly rising trendlines used in price projection are estimates of the dominating angle where price reacts most to these trendlines.
Descending triangles can be also top or bottom trend reversal patterns.
In this triangle price projection is made from all time high to 0.1360 projection distance.
The almost horizontal bottom of the triangle is at 0.618 projection level -- and the price projection down is at the 1.618 level.
That level meets major previous bottom with the lowest parallel trendline .
Price reactions at 0.786 and 1.00 projection levels should be confirmations of that the trendlines angle is correct.
If price breaks upwards from the triangle -- the price projections down are falsified.
Descending triangles can be also top or bottom trend reversal patterns.
In this triangle price projection is made from all time high to 0.1360 projection distance.
The almost horizontal bottom of the triangle is at 0.618 projection level -- and the price projection down is at the 1.618 level.
That level meets major previous bottom with the lowest parallel trendline .
Price reactions at 0.786 and 1.00 projection levels should be confirmations of that the trendlines angle is correct.
If price breaks upwards from the triangle -- the price projections down are falsified.
노트
Now the price is at breakup or dropdown level
면책사항
해당 정보와 게시물은 금융, 투자, 트레이딩 또는 기타 유형의 조언이나 권장 사항으로 간주되지 않으며, 트레이딩뷰에서 제공하거나 보증하는 것이 아닙니다. 자세한 내용은 이용 약관을 참조하세요.
면책사항
해당 정보와 게시물은 금융, 투자, 트레이딩 또는 기타 유형의 조언이나 권장 사항으로 간주되지 않으며, 트레이딩뷰에서 제공하거나 보증하는 것이 아닙니다. 자세한 내용은 이용 약관을 참조하세요.