
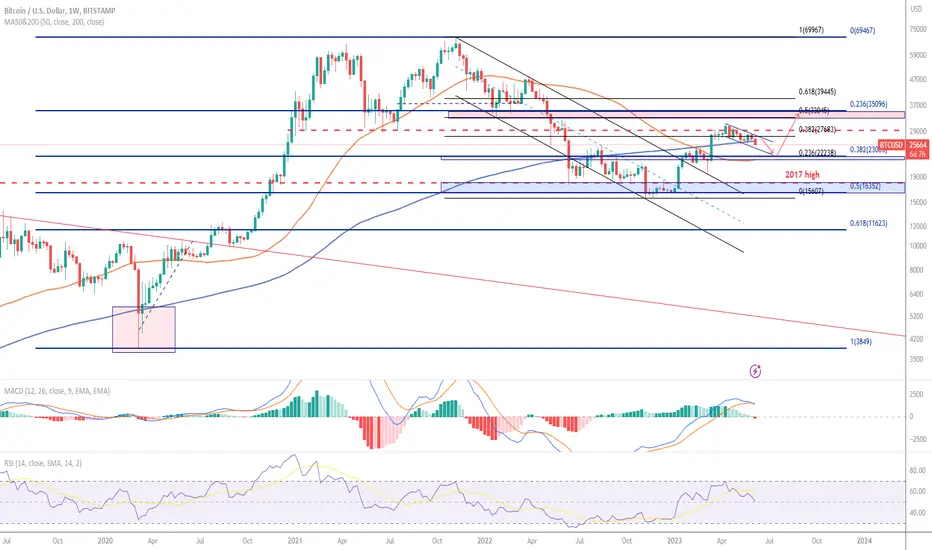
When in doubt zoom out is a common statement in the Bitcoin community. So, let's do so by looking at the weekly timeframe.
Bitcoin formed a strong base between the blue 50% Fibonacci level at $16,350 and the 2017 high of $18,000 in the 1H203 and has gone on to touch a yearly high of $31,295. The resistance rate between the black 38.2% Fibonacci retracement level of $27,580 and $29,500 has however held its ground. Bitcoin is currently testing its 200-week MA rate of $26,450 and a break below this support rate will see it slide lower onto the 50-week MA rate of $22,245 which coincides with the black 23.6% Fibonacci retracement level and the blue 38.2% Fibonacci retracement level.
The support on the 50-week MA is crucial. A break below it will allow bears to pull Bitcoin back into the base formed in December 2022 and January 2023. If the 50-week MA holds it ground Bitcoin will however be geared to move higher and test the resistance rate between $32,945 (black Fibonacci retracement level) and $35,000 (blue 23.6% Fibonacci retracement level).
In terms of technical indicators, the weekly MACD is holding a sell signal and the RSI still has room to drift lower before hitting oversold levels. I will personally be a buyer at levels around the 50-week MA rate.

관련 발행물
면책사항
해당 정보와 게시물은 금융, 투자, 트레이딩 또는 기타 유형의 조언이나 권장 사항으로 간주되지 않으며, 트레이딩뷰에서 제공하거나 보증하는 것이 아닙니다. 자세한 내용은 이용 약관을 참조하세요.
면책사항
해당 정보와 게시물은 금융, 투자, 트레이딩 또는 기타 유형의 조언이나 권장 사항으로 간주되지 않으며, 트레이딩뷰에서 제공하거나 보증하는 것이 아닙니다. 자세한 내용은 이용 약관을 참조하세요.