
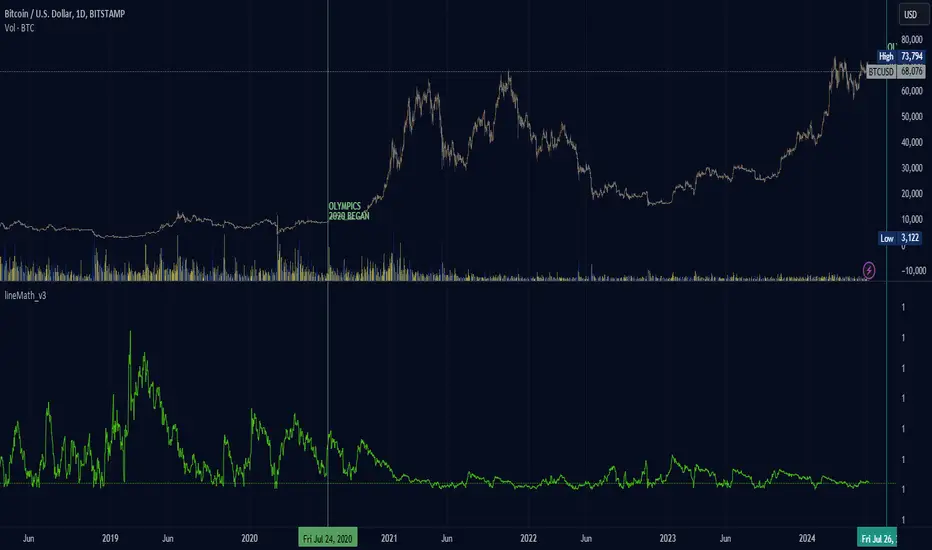
not sure what I created here; the indicator line shows slope information that leads before the price increases in the future. may have something to do with the halving and reduction in BTC. the green line decreases as the price grows in the same way a previous chart prices look smaller as the price reaches higher. the only difference here is that the graph lines are happening before the price of BTC peaks, odd. ...now I have to wait to see if the indicator line changes dramatically ahead of the price of BTC...

면책사항
해당 정보와 게시물은 금융, 투자, 트레이딩 또는 기타 유형의 조언이나 권장 사항으로 간주되지 않으며, 트레이딩뷰에서 제공하거나 보증하는 것이 아닙니다. 자세한 내용은 이용 약관을 참조하세요.
면책사항
해당 정보와 게시물은 금융, 투자, 트레이딩 또는 기타 유형의 조언이나 권장 사항으로 간주되지 않으며, 트레이딩뷰에서 제공하거나 보증하는 것이 아닙니다. 자세한 내용은 이용 약관을 참조하세요.