
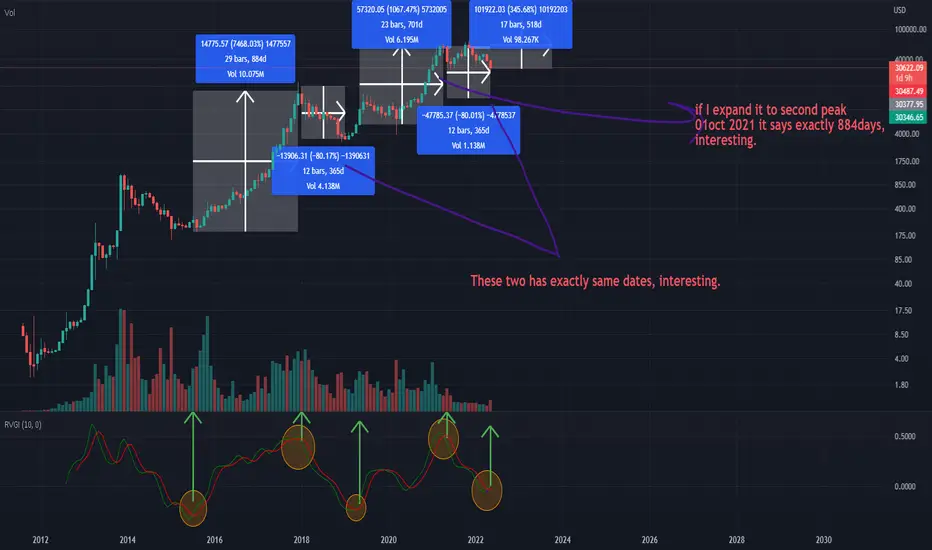
All the ideas are on the chart. You need to know that you should ignore if RVGI crosses in series, it only makes sense if it crosses after not crossing for a long time.
I can see that I ignore a couple of things like we didn't spend all 365 days on bear market after last downside cross of RVGI, actually no explanation for that I just think from 64k to 69k in 7 months is not exactly bull market we just spend a couple of months correction and accumulation then tried to put another ride but the time was not right.
I can see that I ignore a couple of things like we didn't spend all 365 days on bear market after last downside cross of RVGI, actually no explanation for that I just think from 64k to 69k in 7 months is not exactly bull market we just spend a couple of months correction and accumulation then tried to put another ride but the time was not right.

면책사항
해당 정보와 게시물은 금융, 투자, 트레이딩 또는 기타 유형의 조언이나 권장 사항으로 간주되지 않으며, 트레이딩뷰에서 제공하거나 보증하는 것이 아닙니다. 자세한 내용은 이용 약관을 참조하세요.
면책사항
해당 정보와 게시물은 금융, 투자, 트레이딩 또는 기타 유형의 조언이나 권장 사항으로 간주되지 않으며, 트레이딩뷰에서 제공하거나 보증하는 것이 아닙니다. 자세한 내용은 이용 약관을 참조하세요.